# Introduction

CyberCyte is an AI-driven threat exposure and GRC management platform (X-CTEM) that creates a unified posture for the internal and external attack surface. The platform acts as an early warning system to identify security gaps attackers can exploit for internal and external exposure. Based on ISO 27001, CIS, NIST, DORA, Cyber Essentials and other regulatory frameworks, it performs a consolidated maturity and compliance analysis for threats, vulnerabilities, and misconfigurations.

\
As a technology partner to major EDR/XDR vendors (Microsoft Defender, CrowdStrike, Palo Alto Cortex,…), vulnerability scanners (Nessus, Tenable, Acunetix, ZAP, etc.), and other key security solutions CyberCyte creates the most comprehensive exposure visibility for organisations.\
With the Power of AI, the platform empowers security teams to perform more by automating remediation and response actions.

## CyberCyte Benefits

·        Enable immediate identification of security gaps.

·        Measure ransomware infection and information leakage risk by executing EDR and DLP effectiveness assessments covering all endpoints and servers. &#x20;

·        Validate the effectiveness of the existing security infrastructure and the security controls.

·        Identify and remediate configuration gaps based on CIS, DoD, BSI, and MSFT security baselines.

·        Create a centralized remediation and response infrastructure.

·        Analyze unknown forensic artifacts to identify hidden threats and uncompliant activity.

·        Track zero-day and exploited vulnerabilities.

·        Map the impact of the discovered risks against standards like NIST, ISO 27001 and CIS through the GRC dashboard.

## Main Modules

### Cyber GRC

Simplify GRC management and streamline assessments for standards like ISO 27001, CIS, DORA and Cyber Essentials.

### Continuous Security Testing

Continuously assess, consolidate and respond to threats, vulnerabilities and misconfigurations, enabling AI-powered false-positive elimination. Internal/External vulnerabilities, dark web presence, data leaks, CIS-based assessments and other exposure tests are performed.&#x20;

### Exposure Management

Unified internal and exposure analysis to discover unknown risks and shadow-IT.&#x20;

### Automation with the Power of AI

Empower security teams to perform more by automating routine tasks for remediation and response.

<figure><img src="/files/ypkHEmGB903GC1VcruTK" alt=""><figcaption></figcaption></figure>

The platform provides a simple wizard for summarizing the main features of the platform. The wizard can be accessed anytime by clicking the wand icon on the top right section of the user interface.&#x20;

The modules of the platform are accessible from the left menu.

* **Home** provides the results of every artifact and asset analysis with dashboards. The dashboards are Threat Overview, Risk Analysis by Artifact, Risk Analysis by Rule Name, Risk Analysis by Asset, KPI Analysis, Windows Host Summary, and Unclassified Artifacts Analysis.&#x20;
* **Threat Hunter** provides Notable Events, Analysis & Investigation, Visualization, Hunting Settings, and E-Mail/Teams Settings.
* **Threat Response** provides Response Management, Case/Incident Management, Remediation & Response Settings, and Case Management Settings.
* **Security Assurance** provides Hardening & Configuration Management, Vulnerability Management, Remediation, Software Management, Remediation & Response Settings, and Hardening & Configuration Management Settings.
* **Asset Management** provides Endpoint Management and Group Management.
* **Rules & Policies** provides Artifact Classification, Policy Management, SIGMA/YARA Rules, and Artifact Collection Parameters.
* **GRC** provides Assessment Management, Risk Management, Assets, Evidences, Parameters, and GRC settings.
* **Settings & Reporting** provides Agents & Sensor Settings, Deployment Settings, Notification Settings, Integration Settings, Credential Settings, Organization Settings, Reporting, Users & Groups.
* **Troubleshooting** provides an Event Log, Alert Log, Version & Exception Overview.


# Registration

## Creating an Account

&#x20;For registration, please visit <https://portal.cloudcyte.com/signup> and complete the registration form.&#x20;

![Figure 1. Registration Page](/files/-MOGN6QpjtegEesRK6st)

| Field              | Explanation                                                                                                                   |
| ------------------ | ----------------------------------------------------------------------------------------------------------------------------- |
| **Entity Name**    | Name of your company                                                                                                          |
| **First Name**     | Your name                                                                                                                     |
| **Last Name**      | Your last name                                                                                                                |
| **E-mail Address** | <p>Your e-mail address. It will be used as the login name.</p><p>An account activation mail will be sent to this address.</p> |
| **Telephone**      | Your mobile number.                                                                                                           |

After submitting the form, the system generates a verification mail to the provided e-mail address to finalise the registration.&#x20;

To activate your account, click "Activate my account" in the mail , and create a password for the account to log in to the system.

![Figure 2. Setting Password ](/files/-MTjqmFwGlbvMmeIN9ek)

Please click "Submit" to finish the registration process.  You will be logged in to the system.

## Logging in to the System

After registration, the system automatically logs in to the system. You can also access the login page by using <https://portal.cloudcyte.com/signin> and enter your e-mail address and password.&#x20;
![Figure 4. Log in to The System](/files/-MTjrJ5w0hEBK6R5Gqyz)


# Pre-Requirements & Initialization of the Platform


# Agent Installations


# Active Directory Windows Agent Installation

## Option 1: Prepare the MSI Package

* Please navigate to "Settings & Reporting" -> "Deployment Settings" page.
* On that page, copy your tenant-specific URL parameter and then download the MSI (x64) installer.

**Note**: The URL parameter is tenant-specific. Do not share it outside your organization.&#x20;

## Option 2: Prepare the EXE Package

* Please navigate to "Settings & Reporting" -> "Deployment Settings" page.
* On that page download the EXE agent.&#x20;

**Note**: The agent is tenant-specific. Do not share it outside your organization

## Deploy Agent with Bat/PowerShell Script

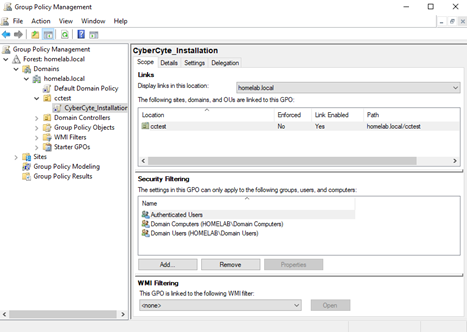
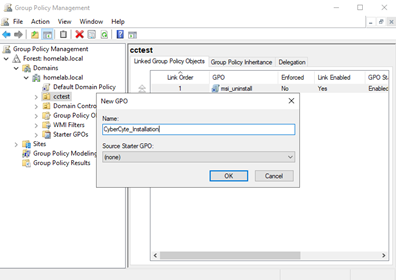
* Please navigate to "Group Policy Managment" and create a new GPO under the OU.

<figure><img src="/files/9Zk5a77qyEdecOX7gEGA" alt=""><figcaption></figcaption></figure>

* The GPO name can be "CyberCyte\_Installation".

<figure><img src="/files/AYwHmXje6WFfF2MUH9Kc" alt=""><figcaption></figcaption></figure>

* Under the "Scope" -> "Security Filtering" add Domain Computers and Domain Users.

<figure><img src="/files/u0I4rLowP6HRVGvpariU" alt=""><figcaption></figcaption></figure>

* Right-click on the GPO and select "Edit".

<figure><img src="/files/JGL7X0RnAzY4P3SBuUEp" alt=""><figcaption></figcaption></figure>

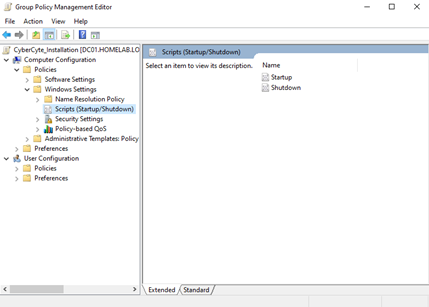
* The "Group Policy Managment Editor" will appear. Please navigate to "Computer Configuration" -> "Policies" -> "Windows Settings" -> "Scripts (Startup/Shutdown)".

<figure><img src="/files/qjvgOBafGpiMHw2Yd0rE" alt=""><figcaption></figcaption></figure>

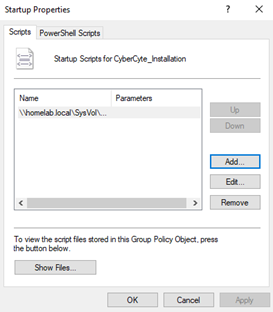
* Double-click on the "Startup" and add the script. The script can be .bat format or .ps1 format, it is optional. Please make sure the script location is under the default script path, e.g:“\\\dc01\sysvol\domain.local\scripts\install.bat”.
* Also, please upload CyberCyte package under the default script path, same as the startup script. The script and the package should be in the same directory for proper installation.
* Click "Apply" and exit.
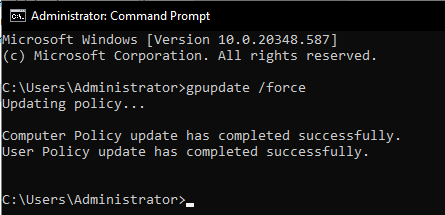
* Run "gpupdate /force" in CMD.

<figure><img src="/files/tZaNMLD9pfbiG60erZY5" alt=""><figcaption></figcaption></figure>

* The machines should get the policy after the next startup.
* For execution logs, please navigate to "C:\ProgramData\ ". The logs will appear after the startup script execution.

## Additional Configurations and Troubleshooting

* Please make sure the startup scripts are always wait by default:
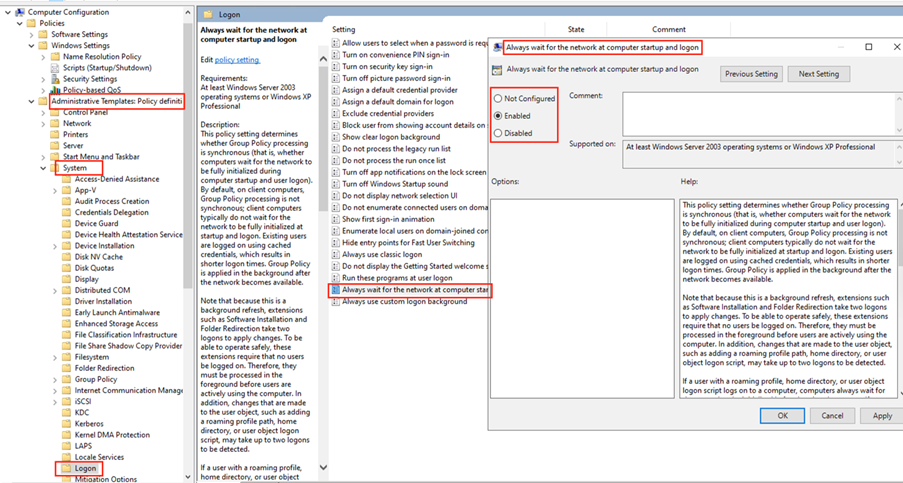
* Please navigate to “Computer Configuration” → “Policies” → “Administrative Templates” → “System” → “Logon”
* Set “Always wait for the network at computer startup and logon” = Enabled.

<figure><img src="/files/IaEikrLIMm2re7X24joG" alt=""><figcaption></figcaption></figure>

<figure><img src="/files/FPRUhxvKRlatCZsSQgv8" alt=""><figcaption></figcaption></figure>

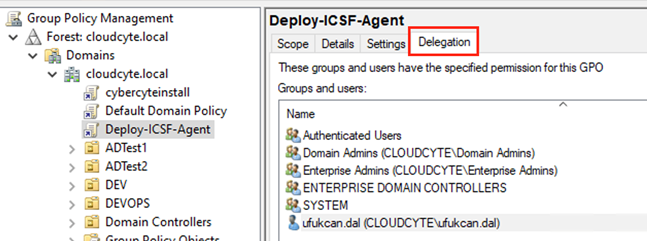
* We can edit the delegation if it is required Click on the GPO and navigate the Delegation section.

<figure><img src="/files/3BfXKy621UNqiOVeY58F" alt=""><figcaption></figcaption></figure>

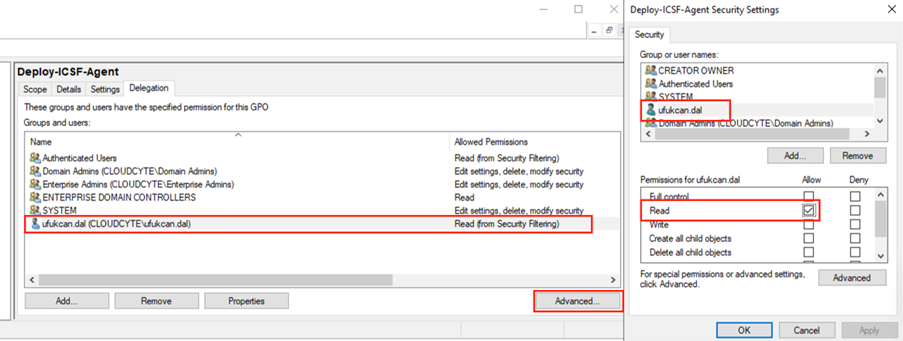
* Click the advanced button. Then select the user, computer or group. Give the read permission. Read permission is enough.

<figure><img src="/files/I1HnlFVnhJlrxL5fiFam" alt=""><figcaption></figcaption></figure>

## Startup Scripts

* Bat script for exe formatted agent:

```
@echo off
setlocal enableextensions

set "SRC=\\<domain-name-eg-contoso.com>\<gp-startup-path>\<PM Installer Name>"
set "LOG=C:\ProgramData\CyberCyte_exe_uninstall_install.log"

echo [%date% %time%] START >> "%LOG%"

if not exist "%SRC%" (
  echo [%date% %time%] FILE NOT FOUND: %SRC% >> "%LOG%"
  exit /b 1
)

start /wait "" "%SRC%" --silent --reinstallOnProblem --install --versioncheck=true  >> "%LOG%" 2>&1
set "RC=%ERRORLEVEL%"

echo [%date% %time%] FINISH ExitCode=%RC% >> "%LOG%"
exit /b %RC%
```

* Bat script for msi formatted agent:

```
@echo off
setlocal enableextensions
set "LOG=C:\ProgramData\CyberCyte_msi_uninstall_install.txt"
set "MSILOG=C:\ProgramData\uninstall_install_log.txt"
set "MSI=\\<domain-name-eg-contoso.com>\<gp-startup-path>\<PM Installer Name>"

echo [%date% %time%] START >> "%LOG%"

if not exist "%MSI%" (
  echo [%date% %time%] MSI NOT FOUND: %MSI% >> "%LOG%"
  exit /b 1619
)

:: Agent will uninstall if agent is already installed, then install it again...
start /wait msiexec.exe /i "%MSI%" ^
  REINSTALL_ON_PROBLEM=true ^
  URL="URL" ^
  PROXY_URL= ^
  PROXY_USERNAME= ^
  PROXY_PASSWORD= ^
  /qn /norestart /l*v "%MSILOG%"

echo [%date% %time%] FINISH ExitCode=%errorlevel% >> "%LOG%"
exit /b %errorlevel%
```

* Ps1 script for exe formatted agent:

```
$ErrorActionPreference = 'Stop'

$SRC = '\\<domain-name-eg-contoso.com>\<gp-startup-path>\<PM Installer Name>'
$LOG = 'C:\ProgramData\CyberCyte_exe_uninstall_install.log'

function Log($t){
    "$((Get-Date).ToString('yyyy-MM-dd HH:mm:ss'))  $t" | Out-File -FilePath $LOG -Append -Encoding UTF8
}

Log 'Powershell Script Starting'

if (-not (Test-Path $SRC)) {
    Log "NOT FOUND: $SRC"
    exit 1619
}

try {
    Log "EXEC: $SRC --silent --uninstall --install --versioncheck=false"
    $p = Start-Process -FilePath $SRC -ArgumentList '--silent --uninstall --install --versioncheck=false' -Wait -PassThru -WindowStyle Hidden
    $rc = $p.ExitCode
    Log "FINISH ExitCode=$rc"
    exit $rc
}
catch {
    Log "EXCEPTION: $($_.Exception.Message)"
    if ($_.Exception.InnerException) { Log "INNER: $($_.Exception.InnerException.Message)" }
    exit 1
}

Log 'Powershell Script Finished'
```

* Ps1 script for msi formatted agent:

```
Start-Transcript -Path C:\ProgramData\uninstall_install_log.txt -Append
Write-Output "Powershell Script Starting: $(Get-Date)"
 
$msiPath = "\\<domain-name-eg-contoso.com>\<gp-startup-path>\<PM Installer Name>"
$installArgs = "/i `"$msiPath`" /qn URL=`"URL`" PROXY_URL=`` PROXY_USERNAME=`` PROXY_PASSWORD=`` /norestart RUN_UNINSTALL_SCRIPT=true UNINSTALL_OPTION=uninstallall"

try {
   $process = Start-Process -FilePath "msiexec.exe" -ArgumentList $installArgs -Wait -PassThru -WindowStyle Hidden
   Write-Output "Exit Code: $($process.ExitCode)"
   Write-Output "Installation finished: $(Get-Date)"
}
catch {
   Write-Output "Error: $($_.Exception.Message)"
}

Write-Output "Powershell Script Finished: $(Get-Date)"

Stop-Transcript
```


# Windows Installation

## Pre-Requirements

The CyberCyte' s Windows agent is requires Microsoft .NET 4.7.2 or above version. Please download the latest .NET version with this link below:

MS .NET Framework Offical Website: <https://dotnet.microsoft.com/en-us/download/dotnet-framework>

If the agent will be run on the older devices, please check out the compatible operating systems with this link below:

MS .NET Framework Compatibility List: <https://learn.microsoft.com/en-us/dotnet/framework/get-started/system-requirements>

The CyberCyte Windows agent supports the Windows operating systems listed below:

* Windows 10
* Windows 11
* Windows Server 2016
* Windows Server 2019
* Windows Server 2022
* Windows Server 2025

## The Agent Deployment

Go to "Settings & Reporting" -> "Deployment Settings", then click on "Download". The executable Windows agent should be started after that. Once it is downloaded, click to run the executable, and when it is done, the machine data will be added to the portal.

Once the agent is deployed, please check that the initial data is being populated. Initial Sysmon data can take up to 15-20 minutes to be available within the system based on the configured parameters. Autoruns, processes, inventory data, and device information are available for Windows agents.

<figure><img src="/files/wlYgAOFIZbsYrFCCt5Cc" alt="" width="375"><figcaption></figcaption></figure>

*For Single Executable to Install:*&#x20;

`"<path_to_custom_exe>" --silent --reinstallOnProblem --install --versioncheck=true`

*For Single MSI to Install:*&#x20;

`msiexec /i "<path_to_msi_package>" /qn /norestart REINSTALL_ON_PROBLEM=true URL="<URL>" PROXY_URL="<PROXY_URL>" PROXY_USERNAME="<PROXY_USERNAME>" PROXY_PASSWORD="<PROXY_PASSWORD>" /l*v "C:\ProgramData\install_log.txt`

It automatically installs required applications and services on the client's machine.&#x20;

PMService: Responsible for agent package updates and ensures agent service is running.&#x20;

ICSFAgentService: Collects data from the client and executes actions. Monitored by PMService and started if stopped automatically.

After installing PM Service, it automatically connects your instances, downloads the Windows Agent installer, and executes the installation process. Because PM Service downloads Agent Installer from download.cloudcyte.com, please ensure that client devices can access this domain and download .exe files from here.

{% hint style="info" %}
Note: Both applications require .NET SDK 4.6 or newer version
{% endhint %}

## Checking Installation&#x20;

After installation of the agent, the agent registers itself automatically with the server. Please go to Endpoint & Network Devices →Endpoint Management →Asset Management to see the agent. It may take a couple of minutes to appear device on this screen.

Agents should be able to access CyberCyte Server on Port 443 and <https://download.cloudcyte.com> websites. If the agent is not shown here, please check access to the portal on the client first. If the entry is successful, please wait for communication interval settings.

## Agent Path and Services

Services

| Service Name     | Display Name     |
| ---------------- | ---------------- |
| PMService        | PMService        |
| ICSFAgentService | ICSFAgentService |

Main Executables

| Process Name              | Full Path                                                                   |
| ------------------------- | --------------------------------------------------------------------------- |
| ICSFAgentService.exe      | C:\Program Files\ICSFAgentService\ICSFAgentService.exe                      |
| PMService.exe             | C:\Program Files\PMService\PMService.exe                                    |
| EndPointDataCollector.exe | C:\Program Files\ICSFAgentService\files\collector\EndPointDataCollector.exe |

Note: Before starting the installation, please white list the below directories for the above three executables:

```
          C:\Program Files\ICSFAgentService    (and subdirectories) 
          C:\Program Files\PMService     (and subdirectories) 
          C:\Program Files\THApplications    (and subdirectories) 
          C:\ProgramData\ICSFAgent     (and subdirectories) 
          C:\ProgramData\ICSFPackageManager   (and subdirectories) 
```

C:\ProgramData\PMService\ (and subdirectories)

In some cases, EDR/AV software does not allow directory-based whitelisting. In such a case, the below files should be permitted:

| Process Name                           | Full Path                                                                                                                                                              |
| -------------------------------------- | ---------------------------------------------------------------------------------------------------------------------------------------------------------------------- |
| Sysmon Executable                      | C:\Windows\cyrthwinsys.exe                                                                                                                                             |
| Sysmon Executable                      | C:\Windows\<When-Other-Name-Used>.exe                                                                                                                                  |
| ICSFAgentService.exe                   | C:\Program Files\ICSFAgentService\ICSFAgentService.exe                                                                                                                 |
| PMService.exe                          | C:\Program Files\PMService\PMService.exe                                                                                                                               |
| EndPointDataCollector.exe              | C:\Program Files\ICSFAgentService\files\collector\EndPointDataCollector.exe\`                                                                                          |
| Agent Installer Installed By PMService | <p>C:\Program Files\PMService\packages\windows agent\latest\files\ICSFAgentSetup.exe</p><p>Permit: C:\Program Files\PMService\packages\windows agent\latest\files\</p> |
| PM Installer Installed By Agent        | <p>C:\ProgramData\PMService\Temp\PMInstaller\*.exe</p><p>Permit: C:\ProgramData\PMService\Temp\</p>                                                                    |
| Agent Installer Installed By PMService | C:\Program Files\PMService\files\windows agent\WindowsAgent.exe                                                                                                        |
| PM Uninstaller                         | C:\ProgramData\ICSFPackageManager\PMUninstaller.exe                                                                                                                    |
| ICSF Uninstaller                       | C:\ProgramData\ICSFAgent\ICSFAgentUninstaller.exe                                                                                                                      |
| Autorunsc Tool                         | C:\Program Files\ICSFAgentService\files\ps\sysinternals\autorunsc64.exe                                                                                                |
| Sigcheck Tool                          | C:\Program Files\ICSFAgentService\files\ps\sysinternals\sigcheck64\_v2.90.exe                                                                                          |
| Web Shell Analyzer                     | C:\Program Files\ICSFAgentService\files\ps\webshell\wsa.exe                                                                                                            |
| Sysmon Executable                      | C:\Program Files\THApplications\cyrthwinsys.exe                                                                                                                        |
| Sysmon Executable                      | C:\Program Files\THApplications\ .exe                                                                                                                                  |

## Checking the Agent Status

* Using Services:
  * Execute this command in the shell and check if ICSFAgent and PMService is running:
    * `services.msc`
* Using CyberCyte Portal:
  * Go to the "Asset Management" -> "Endpoint Management" on the portal. All of the agents will be listed under this page.

## Uninstalling/Disabling the Agent

* IMPORTANT: The agent and package manager always checks each other and if one of the service is down  or deleted, other service automaticly restores the other service. To delete them completely, you need to delete both of them one after the other.
* Using Command Line:
  * Execute these commands in the command line:
    * *For Single MSI to Uninstall:*

      `msiexec /x "C:\ProgramData\PMService\PMUninstaller.msi" /qn /norestart UNINSTALL_OPTION=uninstallall /l*v "C:\ProgramData\PMService\uninstall_log.txt"`
    * *For Single MSI to Uninstall With Sysmon:*

      `msiexec /x "C:\ProgramData\PMService\PMUninstaller.msi" /qn /norestart UNINSTALL_OPTION=`uninstallallwithsysmon `/l*v "C:\ProgramData\PMService\uninstall_log.txt"`
    * *For Single Executable to Uninstall With Sysmon:*

      `"C:\ProgramData\PMService\PMUninstaller.exe" --uninstallallwithsysmon --silent`&#x20;
    * For Manually uninstall the agent:

{% file src="/files/410527h1KvAkPFp2lBxU" %}

* Using Control Panel:
  * CyberCyte agent not visible on the Control Panel, please execute commands or ps1 script above to uninstall the agent completely.
* Disabling the Agent:
  * Go to the "Asset Management" -> "Endpoint Management" on the portal. Right-click on the machine and disable the agent. This action only disables agent data collection, the agent will update itself but not collect any data.

## Detailed Parameters for Agents

**MSI Install/Uninstall Parameters**

* `/qn`: Quite installation process
* `/norestart`: No restart after installation process
* `<path_to_msi_package>`: MSI packge path on downloaded computer
* `REINSTALL_ON_PROBLEM`: Flag to check if current installed services are corrupted or not. Options: `true`, `false`
* `RUN_UNINSTALL_SCRIPT`: Flag to run uninstall script before installation. Options: `true`, `false`
* `UNINSTALL_OPTION`: Uninstall option to uninstall ICSFAgent and PMService. Options: `uninstall`, `uninstallagent`, `uninstallall`
  * `uninstall`: To uninstall only PM service
  * `uninstallagent`: To uninstall only ICSFAgent service
  * `uninstallall`: To uninstall PM and ICSAgent services
* `<URL>`: PM config url. It is already in place.
* `<PROXY_IP_ADDRESS>`: It will be coming as filled if it exists in organization
* `<PROXY_PORT>`: It will be coming as filled if it exists in organization
* `<PROXY_USERNAME>`: It will be coming as filled if it exists in organization
* `<PROXY_PASSWORD>`: This will not be set automatically. User should enter password by hand.
* `/l*v "C:\ProgramData\PMService_install_log.txt"` -> This is for logging installation process

Examples:

* Only installation:`msiexec /i "<path_to_msi_package>" /qn /norestart URL="<URL>" PROXY_URL="<PROXY_URL>" PROXY_USERNAME="<PROXY_USERNAME>" PROXY_PASSWORD="<PROXY_PASSWORD>" /l*v "C:\ProgramData\PMService_install_log.txt"`
* Uninstall-Install:`msiexec /i "<path_to_msi_package>" /qn /norestart RUN_UNINSTALL_SCRIPT=true UNINSTALL_OPTION=uninstallall URL="<URL>" PROXY_URL="<PROXY_URL>" PROXY_USERNAME="<PROXY_USERNAME>" PROXY_PASSWORD="<PROXY_PASSWORD>" /l*v "C:\ProgramData\PMService_uninstall_install_log.txt"`
* Uninstall-Install if current installation is corrupted:`msiexec /i "<path_to_msi_package>" /qn /norestart REINSTALL_ON_PROBLEM=true URL="<URL>" PROXY_URL="<PROXY_URL>" PROXY_USERNAME="<PROXY_USERNAME>" PROXY_PASSWORD="<PROXY_PASSWORD>" /l*v "C:\ProgramData\PMService_reinstall_on_problem_log.txt"`

**MSI Uninstall Parameters**

* Uninstaller path: `"C:\ProgramData\PMService\PMUninstaller.msi"`
* Command: `msiexec /x "C:\ProgramData\PMService\PMUninstaller.msi" /qn /norestart UNINSTALL_OPTION=uninstallall /l*v "C:\ProgramData\PMService_uninstall_log.txt"`
* All parameters:
  * `/qn`: Quite installation process
  * `/norestart`: No restart after installation process
  * `/l*v "C:\ProgramData\PMService_uninstall_log.txt"` -> This is for logging installation process
  * UNINSTALL\_OPTION -> `uninstall`, `uninstallall`, `uninstallallwithsysmon`, `uninstallagent`, `uninstallsysmon`
    * `uninstall`: To uninstall only PM service
    * `uninstallall`: To uninstall PM and ICSAgent services
    * `uninstallallwithsysmon`: To uninstall PM, ICSAgent and sysmon services
    * `uninstallagent`: To uninstall only ICSFAgent service
    * `uninstallsysmon`: To uninstall only sysmon service

**Custom PMService Parameters**

* Install: `"<path_to_custom_exe>" --silent --install --versioncheck=false`
* Uninstall-Install: `"<path_to_custom_exe>" --silent --uninstall --install --versioncheck=false`
* Uninstall-Install on problem only (Will not install if already not installed. Only will check if installed version is corrupted.): `"<path_to_custom_exe>" --silent --reinstallOnProblem`
* Uninstall-Install on problem, install if not installed: `"<path_to_custom_exe>" --silent --reinstallOnProblem --install --versioncheck=true`
* Uninstall: `"C:\ProgramData\PMService\PMUninstaller.exe" --uninstall --silent`
* All parameters:
  * `--reinstallOnProblem`: Flag to check if current installed services are corrupted or not. Default is false if not specified.
  * `--versioncheck`: Flag to decide if version will be installed regardless of the installed version. Default is true if not specified.
    * `--versioncheck=true` -> With this value, PMInstaller will check if version is already installed. If not, it will install; if installed, installation will skipped.
    * `--versioncheck=false` -> With this value, PMInstaller will remove installed version and install new version, no matter what the version is.
* Uninstall options:
  * `--uninstall`: To uninstall only PM service
  * `--uninstallall`: To uninstall PM and ICSAgent services
  * `--uninstallallwithsysmon`: To uninstall PM, ICSAgent and sysmon services
  * `--uninstallagent`: To uninstall only ICSFAgent service
  * `--uninstallsysmon`: To uninstall only sysmon service


# Linux Installation

## Pre-Requirements

The CyberCyte' s Linux agent requires a offical or local repository. The system will download "osquery" with latest version.

Optionally the agent will download "nmap" and "Docker" with latest verison. For Docker repositories, please allow connection to these registries:

* registry.community.greenbone.net
* hub.docker.com

The CyberCyte Linux agent supports the Linux based operating systems like listed below:

* Debian 9 and above
* Ubuntu 18.04 and above
* RHEL 8 and above
* CentOS 9 and above
* SUSE Linux (Coming soon)

## The Agent Settings

The Agent installer link is created dynamically when downloaded. Once the agent is downloaded, it is available from "Settings & Reporting" -> "Deployment Management".

<figure><img src="/files/xojlBqLbBvSwXLprbXjV" alt=""><figcaption></figcaption></figure>

From this section, basic agent parameters can be configured by clicking the "Linux Agent Settings " button.

<figure><img src="/files/5g2DCJk6ru1ZaWQfH2Ky" alt=""><figcaption></figcaption></figure>

**Agent Configurations**

| Settings Name              | Explanation                                 |
| -------------------------- | ------------------------------------------- |
| Communication Interval     | Agent communication interval to the Server  |
| Data Sending Interval      | Agent data send interval to the Server      |
| Update Check Interval      | Agent update check interval from the Server |
| Service Iteration Interval | Agent sleeps for this time after each cycle |
| Upload Data Chunk Size     | Number of uploaded entries by one query     |

Once the settings are defined, click the "Save" button, and the system will redirect to the download page. Click the "Copy" button to copy the agent installation command.

The command is used to install and apply the agent's installation script. Please execute it on the servers and clients to install the agent.

Once the download button is clicked, it is created and signed.&#x20;

Note 1: Because of its nature, some EDRs or AV solutions may consider this installer file malicious. Please whitelist this file on your endpoint security products. Also, the services and processes below are deployed. It is recommended that you whitelist them.&#x20;

Services&#x20;

| Service Name            | Display Name                    |
| ----------------------- | ------------------------------- |
| cybercyte\_linux\_agent | cybercyte\_linux\_agent.service |

Installation of Agent &#x20;

After using the wget command, run the command at the endpoints to install the agent. &#x20;

After installing the agent, it automatically registers to the system.&#x20;

Checking Installation&#x20;

After the agent is installed, it registers itself automatically with the Server. Please go to "Asset Management" -> "Endpoint Management" to see the agents. The device may take a couple of minutes to appear on this screen.

Agents should be able to access CyberCyte Server on Port 443 and <https://download.cloudcyte.com> websites. If the agent is not shown here, please check access to the portal on the client first. If the entry is successful, please wait for communication interval settings.

## Adding Necessary Policies And Endpoints To The Linux Servers Group

&#x20;Once the agents are created in Endpoint Management, add them to the Linux Servers Group. Please navigate to "Rules & Policies" -> "Policy Management". Then, add the policy as in Figure 5. In some cases, you need to create the policy for this, following Figure 6. Finally, the endpoint should be added to a Linux-based operating system (Figure 6). After a while, you will see the data from these endpoints.

<figure><img src="/files/v3HbpXsBIhh1XfoOGNCq" alt=""><figcaption></figcaption></figure>

<figure><img src="/files/sBAJrL1X7ZaSLPiAY7Mc" alt=""><figcaption></figcaption></figure>

## Confirm The Installation

Please navigate to "Endpoints & Network Devices" -> "Endpoint Management" -> "Asset Management" on the portal. All machines are synced with the table, and users can observe the machine/agent information from there.

Agents should be able to access CyberCyte Server on Port 443 and [https://download.cloudcyte.com](https://download.cloudcyte.com/) websites. If the agent is not shown, please check access to the portal on the client first. If the entry is successful, please wait for communication interval settings.

## Checking The Agent Status

* Using Shell:
  * Execute this command in the shell:
    * `systemctl status cybercyte_linux_agent.service`
* Using CyberCyte Portal:
  * Go to the "Endpoints & Network Devices" -> "Endpoint Management" -> "Asset Management" on the portal. All of the agents will be listed under this page.

## Uninstalling/Disabling the Agent

* Using Shell:
  * Execute these commands in the shell:

    * `/opt/CyberCyteAgent/CyberCyteAgent —uninstall`
    * This command will uninstall osquery too.

    Or

    * `service=cybercyte_linux_agent.service; systemctl stop $service && systemctl disable $service && rm /etc/systemd/system/$service && systemctl daemon-reload && systemctl reset-failed && rm -rf /opt/CyberCyteAgent`
* Uninstalling the service only:
  * `/opt/CyberCyteAgent/CyberCyteAgent —uninstall-service`
  * This command will uninstall osquery too.
* Disabling the Agent:
  * Go to the "Asset Management" -> "Endpoint Management" on the portal. Right-click on the machine and disable the agent. This action only disables agent data collection, the agent will update itself but not collect any data.

## Troubleshooting

If the agent is not appeared under the "Endpoints & Network Devices" -> "Endpoint Management" -> "Asset Management", please follow these steps to finding the root cause:

* Check the connection between server and CyberCyte portal, the server must communicate CyberCyte via 443 port.
* Check the agent logs under the "/opt/CyberCyteAgent/logs/\<date>\_linux\_agent.txt". Also, please send the log file to "<support@cybercyte.com>".
* Check the agent service on the server. If it is not working, please try to uninstall and re-install again.


# macOS Installation

## Pre-Requirements

The CyberCyte' s macOS agent requires a offical or local repository. The system will download "osquery" with latest version.

Optionally the agent will download "nmap" and "Docker" with latest verison. For Docker repositories, please allow connection to these registries:

* registry.community.greenbone.net
* hub.docker.com

The CyberCyte macOS agent supports the distributions listed below:

* macOS 10.12 and above

## The Agent Settings

The Agent installer link is created dynamically when downloaded. Once the agent is downloaded, it is available from "Settings & Reporting" -> "Deployment Management".

<figure><img src="/files/k0sDgyjjYrrg7K2w4uth" alt=""><figcaption></figcaption></figure>

From this section, basic agent parameters can be configured by clicking the "macOS Agent Settings" button.

<figure><img src="/files/hdEyHKQnrG5JAiR8JiPC" alt=""><figcaption></figcaption></figure>

**Agent Configurations**

| Settings Name              | Explanation                                 |
| -------------------------- | ------------------------------------------- |
| Communication Interval     | Agent communication interval to the Server  |
| Data Sending Interval      | Agent data send interval to the Server      |
| Update Check Interval      | Agent update check interval from the Server |
| Service Iteration Interval | Agent sleeps for this time after each cycle |
| Upload Data Chunk Size     | Number of uploaded entries by one query     |

Once the settings are defined, click the "Save" button, and the system will redirect to the download page. Click the "Download Installer" button to download the agent. This action will start to download the installer. After downloading the installer, please download the config file with the "Download Config File" button. The agent (.pkg) and the config file must be downloaded and they need to be in the folder. To install the agent, please double-click on the downloaded pkg file. The installation will start automatically. Alternatively, the below command can be used.

```bash
sudo installer -pkg /path/to/package.pkg -target /
```

After installing the agent, the machine information can be seen under the "Asset Management" -> "Endpoint Management".

## Adding Necessary Policies and Endpoints to the macOS Devices Group

Once the agents appear in the Endpoint Management, add them to the Linux Servers Group. Please navigate to "Rules & Policies" -> "Policy Management" -> "Group Management". Select the group named "macOS Devices Group". Assign the policy to the required field and click on the "Save" button placed below on the page.

<figure><img src="/files/jHqhdJk7biCbkeGT17e6" alt=""><figcaption></figcaption></figure>

<figure><img src="/files/oKi91iHNqks6XF3Aqmlh" alt=""><figcaption></figcaption></figure>

In some cases, users need to edit/create a new policy. For a new policy please navigate to "Rules & Policies" -> "Policy Management" -> "Policy Rules" and click on the "+ Policy" button. Edit the field as needed and save the policy. After successfully creating a policy, go to "Group Management" and select the "macOS Devices Group". Assign the policy to the group.

<figure><img src="/files/f7w1WGbXqYSY6g1tkh5J" alt=""><figcaption></figcaption></figure>

<figure><img src="/files/ftDssfhwfdYgILmUCblQ" alt=""><figcaption></figcaption></figure>

When policies are assigned to the groups, data collection starts. Users must wait for the next iteration of the collection to see the results.

## Checking the Installation

Please navigate to "Endpoints & Network Devices" -> "Endpoint Management" -> "Asset Management" on the portal. All machines are synced with the table; users can observe the machine/agent information from there.

Agents should be able to access CyberCyte Server on Port 443 and [https://download.cloudcyte.com](https://download.cloudcyte.com/) websites. If the agent is not shown here, please check access to the portal on the client first. If the entry is successful, please wait for communication interval settings.

## Checking the Agent Status

* Using Shell:
  * Execute this command in the shell:
    * `sudo launchctl list | grep cyber`
* Using CyberCyte Portal:
  * Go to the "Endpoints & Network Devices" -> "Endpoint Management" -> "Asset Management" on the portal. All of the agents will be listed under this page.

## Uninstalling/Disabling the Agent

* Using Shell:
  * Execute this command in the shell:
    * `sudo /usr/local/bin/CyberCyteAgent --uninstall`
* Disabling the Agent:
  * Go to the "Endpoints & Network Devices" -> "Endpoint Management" -> "Asset Management" on the portal. Right-click on the machine and disable the agent. This action only disables agent data collection, the agent will update itself but not collect any data.

## Troubleshooting

If the agent is not appeared under the "Endpoints & Network Devices" -> "Endpoint Management" -> "Asset Management", please follow these steps to finding the root cause:

* Check the connection between device and CyberCyte portal, the device must communicate CyberCyte via 443 port.
* Check the logs under "/Library/Application Support/CyberCyteAgent/logs".
* Check the temp folder of the agent under "/tmp/CyberCyteAgent".
* Restart the agent with this command `"<macos_package> --restart" or "`/usr/local/bin/CyberCyteAgent --restart"
* Check the agent status with details:&#x20;
  * `sudo launchctl list com.cybercyte.macagent`\
    `{`\
    `"LimitLoadToSessionType" = "System";`\
    `"Label" = "com.cybercyte.macagent";`\
    `"OnDemand" = false;`\
    `"LastExitStatus" = 0;`\
    `"PID" = 80216;`\
    `"Program" = "/usr/local/bin/CyberCyteAgent";`\
    `};`
* Check the agent service on the device. If it is not working, please try to uninstall and re-install again.


# Deploying Agent From Microsoft Intune

The CyberCyte agent can deployed with intune with .msi format. Please navigate the "Settings & Reporting" -> "Deployment Settings". Click on the "Download x64 MSI" button to download the agent. After the download, users can deploy the agent to the Microsoft Intune platform with recommended parameters, which is predefined on the portal (Please take a look at the "Command to install MSI package" section). Also, if users using the proxy on their system, they can define the proxy parameters for the agent. After the definitions are done, please click on the save button, this action also change the MSI installation command section.

<figure><img src="/files/4BR1qsaNM6fLAWXvo3EI" alt=""><figcaption></figcaption></figure>

After downloading the agent, please login to the Microsoft Intune. Please navigate to "Home" -> "Apps" -> "Windows" and create a new app.

<figure><img src="/files/Oo5ODF9ZaauOROaxDMRV" alt=""><figcaption></figcaption></figure>

<figure><img src="/files/9xtkmbto4mhgXhr5LLrj" alt=""><figcaption></figcaption></figure>

Select the file (CyberCyte package manager) and provide "Name", "Command-line arguments" for "App information" section.

<figure><img src="/files/fgTo9BevyUdWACdk4fW1" alt=""><figcaption></figcaption></figure>

<figure><img src="/files/k5lj0A7FlhOSDEj4Sh56" alt=""><figcaption></figcaption></figure>

In the "Assignments" section the group(s) must be defined, please define the deployment group(s).

<figure><img src="/files/wUOyfvhiHXn2qqVOnDWH" alt=""><figcaption></figcaption></figure>

After the definitions, click on the "Next" button and move on to the "Review + Create" section. Confirm the package definations and after that the agent package is ready for the deployment.


# Access and Exlusion Requirements


# Agent-Based Demo Deployment

## Cloud-Based Demo Deployment Network Permissions

On the client and server machines, please promote these address(es):

<table><thead><tr><th>From</th><th width="249.719970703125">To</th><th>Port</th><th>Purpose</th></tr></thead><tbody><tr><td>Client &#x26; Server Devices</td><td>https://cdemo.cloudcyte.com</td><td>TCP 443</td><td>The Agent should communicate Portal server directly if Agent installed on User devices</td></tr></tbody></table>

If users want to create an organization in Turkey region, please promote these address(es):

<table><thead><tr><th>From</th><th width="233.719970703125">To</th><th>Port</th><th>Purpose</th></tr></thead><tbody><tr><td>Client &#x26; Server Devices</td><td>https://tr.cloudcyte.com</td><td>TCP 443</td><td>The Agent should communicate Portal server directly if Agent installed on User devices</td></tr></tbody></table>


# Agent-Based Production Deployment

## Cloud-Based Deployment Network Permissions

On the client and server machines, please promote these addresses:

<table><thead><tr><th>From</th><th width="235.6400146484375">To</th><th>Port</th><th>Purpose</th></tr></thead><tbody><tr><td>Client &#x26; Server Devices</td><td>https://portal.cloudcyte.com</td><td>TCP 443</td><td>The Agent should communicate Portal server directly if Agent installed on User devices</td></tr></tbody></table>

If users want to create an organization in Turkey region, please promote these address(es):

<table><thead><tr><th>From</th><th width="227.3199462890625">To</th><th>Port</th><th>Purpose</th></tr></thead><tbody><tr><td>Client &#x26; Server Devices</td><td>https://tr.cloudcyte.com</td><td>TCP 443</td><td>The Agent should communicate Portal server directly if Agent installed on User devices</td></tr></tbody></table>


# Agent-Based On-Premises Deployment

## On-Premises-Based Deployment Network Permissions

| Portal Server                         | \*.cloudcyte.com                                                         | TCP 443            | Initial Deployment             |
| ------------------------------------- | ------------------------------------------------------------------------ | ------------------ | ------------------------------ |
| Portal Server                         | <p>download.cloudcyte.com<br>s3.cloudcyte.com</p>                        | TCP 443            | Updates and Patches            |
| Portal Server                         | <p>registry.cloudcyte.com</p><p>clapi.cloudcyte.com</p>                  | TCP 443            | Container and API Access       |
| Portal Server                         | \*.sendgrid.com                                                          | TCP 443            | MFA Usage                      |
| <p>Portal Server</p><p>(Optional)</p> | \*.twilio.com                                                            | TCP 443            | SMS Messages                   |
| Portal Server (Optional)              | \*.virustotal.com                                                        | TCP 443            | Threat intelligence            |
| Portal Server                         | <p>login.microsoftonline.com</p><p>cybercytekeyvault.vault.azure.net</p> | TCP 443            | Digital Signing                |
| Scanner Server                        | Portal Server                                                            | TCP 443, ICMP      | Internal Communication         |
| Agents                                | Portal Server                                                            | TCP 443            | Agent Communication            |
| Management Server                     | Portal & Broker & DB Server                                              | TCP 443, ICMP 5432 | Admin Access & troubleshooting |
| Portal Server                         | Database Server                                                          | TCP 5432           | Database Access                |


# Trendmicro Exlusions

&#x20;

Sysmon processes “C:\Windows\cyrthwinsys.exe" ve "C:\Program Files\THApplications\cyrthwinsys.exe" must be excluded for real-time scanning in Trenmicro settings.

&#x20;**Cause:**

"Windows Server freezes after enabling Anti-Malware module in Cloud One - Workload Security"

Windows freezes after enabling the Anti-Malware module. The issue seems to be caused by an interoperability issue between Microsoft System Monitor (Sysmon) and Trend Micro Deep Security Agent (DSA)."

<https://success.trendmicro.com/dcx/s/solution/000294699?language=en_US>

&#x20;The exclusion needs to be done from Trendmicro and in the CyberCyte Platform.

### TrendMicro

It is also suggested to add the following exclusions in the Process Image File list

#### Mandatory

* C:\Windows\sysmon64.exe
* C:\Windows\sysmon.exe
* C:\Windows\cyrthwinsys.exe

#### Optional

| Autorunsc Tool    | C:\Program Files\ICSFAgentService\files\ps\sysinternals\autorunsc64.exe       |
| ----------------- | ----------------------------------------------------------------------------- |
| Sigcheck Tool     | C:\Program Files\ICSFAgentService\files\ps\sysinternals\sigcheck64\_v2.90.exe |
| Sysmon Executable | C:\Windows\cyrthwinsys.exe                                                    |
| Sysmon Executable | C:\Program Files\THApplications\cyrthwinsys.exe                               |
| Sysmon Executable | C:\Program Files\THApplications\ Sysmon64.exe                                 |

Below are  example screenshots: &#x20;

![](blob:https://app.gitbook.com/0b9a50f4-b4fd-4f11-8c02-2576d25aa853)

&#x20;

![](blob:https://app.gitbook.com/29b5c1f1-b8d0-40f8-9a91-b0096835d336)

![](blob:https://app.gitbook.com/53284cc4-4796-41d6-a8e6-ce0ff176b0c9)

&#x20;

![](blob:https://app.gitbook.com/9d9bcfd6-b656-48b2-b9b8-cd33847d2f20)

CyberCyte

&#x20;In Sysmon polices, the tag for Trendmicro should be added to Exlusion Rules from Policy Settings accessed from Rules and Policies -> Policy Management -> Policesi. Example screenshot is provided below:

<figure><img src="/files/ilMJsRhE6bWjOF3g6LKS" alt=""><figcaption></figcaption></figure>

<figure><img src="/files/04vlxh2YC8HwV0eEd9ym" alt=""><figcaption></figcaption></figure>


# Troubleshooting

## General Control

During the agent installation sometimes users are faced with various issues. The most common issues are listed and explained how to fix them.

* Network Communication Problem: Commonly, the network team is not permitted to access the portal and ports. Please double-check the permissions before installation.
* Security Applications Problem: Sometimes the antivirus/EDR solutions can stop or block the agent services. Please make sure exclusions are provided.
* The Portal Misconfigurations: Sometimes, during the deployment process, the parameters can be left empty. Please contact CyberCyte IT support for the solution.
* The Agent Data Collection: If the agent is working but no data is coming to the portal, please check the policies and groups. Sometimes users can forget the policy assignment.
* Checking the Portal: Sometimes users deploy the agents but the agent show no notification on the machine. That's why sometimes users think the agent is not installed properly. In that case, we suggest to check the portal after deployment. Please navigate to "Asset Management" -> "Endpoint Management" on the portal and check if the device has appeared on the grid. If it is not, then users should troubleshoot the problem.

If the agent installation is finished and further analysis is needed for troubleshooting, please navigate to this link below:

{% embed url="<https://docs.cloudcyte.com/troubleshooting/the-agent-troubleshooting>" %}

## Windows

Once the agent is installed, two services are installed:

* PMService: This service performs updates for the agent.
* ICSFAgentService: This service executes all agent functions. When this service is restarted, the agent re-initiates artifact collection policies and registers itself to the server.

The below files and folders can be used for Troubleshooting:

* C:\Program Files\ICSFAgentService\logs\\\<log>.txt: This is the main file used by the agent to write any exception.
* C:\Program Files\ICSFAgentService\logs\\\<folder>: Every module and major artifact collector of the agent creates separate log files, which could be needed for Troubleshooting.
* C:\Program Files\ICSFAgentService\debug.txt: When set to true and the ICSFAgentService is restarted, more detailed logging is enabled.
* C:\Program Files\ICSFAgentService\ICSFAgentService.url.txt: The main URL agent-server communicates is written here if it needs to be checked for Troubleshooting.
* C:\Program Files\ICSFAgentService\files\collector\\\<Collector Name>\_\<Logs/Results/Settings>.txt: Every artifact collection type creates three files under this folder. The settings, log and the last result are available for Troubleshooting.
* C:\ProgramData\ICSFAgentService\PolicyExecutionTime.json: When LastExecutionTime set to "", the collection can be initiated instantly.
* C:\ProgramData\ICSFAgentService\Event Logs Collections: Security logs to be sent to server is stored in this folder.
* C:\ProgramData\ICSFAgentService\Sysmon Logs Collections: Sysmon logs to the server are stored in this folder.
* C:\ProgramData\ICSFAgent\Thor\ThorPolicyExecutionTime.json: When LastExecutionTime is set to "", Thor collections can be started immediately.
* C:\ProgramData\ICSFAgent\Sysmon Settings: Sysmon settings are stored in this folder.
* C:\ProgramData\ICSFPackageManager: Software deployments are managed through this folder.
* C:\ProgramData\PMService: Package manager settings are stored in this folder. The file is encrypted.

Also, please check the machine and server communication with ping, curl, or other tools.

## Linux

For Troubleshooting the agent first of all we need to check the status of the "CyberCyteAgent" with this command:

* `systemctl status cybercyte_linux_agent.service` -> This command gives us the information about the service status.

For further troubleshooting, we can check the logs in the `/opt/CyberCyteAgent/logs/<date>_linux_agent.txt` directory it will give us the both collector and service logs under the directories.&#x20;

`cd /opt/CyberCyteAgent/logs` -> Navigate the log files

`/opt/CyberCyteAgent/CyberCyteAgent --version` -> Get the agent version

`/opt/CyberCyteAgent/CyberCyteAgent --help` -> See detailed help menu for troubleshooting

If the agent is not appeared under the "Endpoints & Network Devices" -> "Endpoint Management" -> "Asset Management", please follow these steps to finding the root cause:

* Check the connection between server and CyberCyte portal, the server must communicate CyberCyte via 443 port.
* Check the agent logs under the "/opt/CyberCyteAgent/logs/\<date>\_linux\_agent.txt". Also, please send the log file to "<support@cybercyte.com>".
* Check the agent service on the server. If it is not working, please try to uninstall and re-install again.

## macOS

If the agent is not appeared under the "Endpoints & Network Devices" -> "Endpoint Management" -> "Asset Management", please follow these steps to finding the root cause:

* Check the connection between device and CyberCyte portal, the device must communicate CyberCyte via 443 port.
* Check the logs under "/Library/Application Support/CyberCyteAgent/logs".
* Check the temp folder of the agent under "/tmp/CyberCyteAgent".
* Restart the agent with this command `"<macos_package> --restart" or "`/usr/local/bin/CyberCyteAgent --restart"
* Check the agent status with details:&#x20;
  * `sudo launchctl list com.cybercyte.macagent`\
    `{`\
    `"LimitLoadToSessionType" = "System";`\
    `"Label" = "com.cybercyte.macagent";`\
    `"OnDemand" = false;`\
    `"LastExitStatus" = 0;`\
    `"PID" = 80216;`\
    `"Program" = "/usr/local/bin/CyberCyteAgent";`\
    `};`
* Check the agent service on the device. If it is not working, please try to uninstall and re-install again.


# Getting Started

This document is a summary of steps to enable users to deploy and implement CloudCyte in their infrastructure.


# Platform  Overview

CyberCyte is an AI-driven threat exposure and GRC management platform (X-CTEM) that creates a unified posture for the internal and external attack surface. The platform acts as an early warning system to identify security gaps attackers can exploit for internal and external exposure. Based on ISO 27001, CIS, NIST, DORA, Cyber Essentials and other regulatory frameworks, it performs a consolidated maturity and compliance analysis for threats, vulnerabilities, and misconfigurations.

\
As a technology partner to major EDR/XDR vendors (Microsoft Defender, CrowdStrike, Palo Alto Cortex,…), vulnerability scanners (Nessus, Tenable, Acunetix, ZAP, etc.), and other key security solutions CyberCyte creates the most comprehensive exposure visibility for organisations.\
With the Power of AI, the platform empowers security teams to perform more by automating remediation and response actions.

## CyberCyte Benefits

·        Enable immediate identification of security gaps.

·        Measure ransomware infection and information leakage risk by executing EDR and DLP effectiveness assessments covering all endpoints and servers. &#x20;

·        Validate the effectiveness of the existing security infrastructure and the security controls.

·        Identify and remediate configuration gaps based on CIS, DoD, BSI, and MSFT security baselines.

·        Create a centralized remediation and response infrastructure.

·        Analyze unknown forensic artifacts to identify hidden threats and uncompliant activity.

·        Track zero-day and exploited vulnerabilities.

·        Map the impact of the discovered risks against standards like NIST, ISO 27001 and CIS through the GRC dashboard.

## Main Modules

### Cyber GRC

Simplify GRC management and streamline assessments for standards like ISO 27001, CIS, DORA and Cyber Essentials.

### Continuous Security Testing

Continuously assess, consolidate and respond to threats, vulnerabilities and misconfigurations, enabling AI-powered false-positive elimination. Internal/External vulnerabilities, dark web presence, data leaks, CIS-based assessments and other exposure tests are performed.&#x20;

### Exposure Management

Unified internal and exposure analysis to discover unknown risks and shadow-IT.&#x20;

### Automation with the Power of AI

Empower security teams to perform more by automating routine tasks for remediation and response.

<figure><img src="/files/LvnD0qDtG0WkxcCtd1sz" alt=""><figcaption></figcaption></figure>

The platform provides a simple wizard for summarizing the main features of the platform. The wizard can be accessed anytime by clicking the wand icon on the top right section of the user interface.&#x20;

The modules of the platform are accessible from the left menu.

* **Most Used** provides quick navigation sections for most used modules.&#x20;
* **Dashboards** provides various artifact analysis dashboards.&#x20;
* **Analysis & Investigation** provides various modules for threat, forensic and discovery.
* **Response Management** provides remediation jobs, remediation logs, Todo mangement and AI activity logs.
* **Security Assurance** provides Hardening, Configuration, Vulnerability and Software Management.
* **GRC** provides Assessment Management, Risk Management, Assets, Evidences, Parameters, and GRC settings.
* **TPRM** provides Vendor Management, Questionnarie Management, TPRM Settings.
* **Endpoints & Network Devices** provides Endpoint Management and Group Management.
* **Rules & Policies** provides Artifact Classification, Policy Management, SIGMA/YARA Rules, and Artifact Collection Parameters.
* **Settings & Reporting** provides Agents & Sensor Settings, Deployment Settings, Notification Settings, Integration Settings, Credential Settings, Organization Settings, Reporting, Users & Groups.
* **Help** provides an Event Log, Alert Log, Version & Exception Overview.


# Agent Based Deployment


# 1. Initial Settings & Deployment

The CyberCyte Portal allow users to configure the initial settings in a minute. This section includes:

* Notification,
* Reporting,
* Agent deployment,
* Policy management

Also, these configurations can be done manually one by one. But for quick setup, we highly recommend this section. Please navigate to "Most Used" -> "Initial Settings & Deployment" to access.&#x20;

<figure><img src="/files/YpQA77AgSPwqOu3pemN2" alt=""><figcaption></figcaption></figure>


# 2. Activating Policies

CyberCyte agents work with policies. The first step is to review the policies and decide which ones will be applied. Please go to Rules & Policies -> Policy Management. Make sure the default policies are enabled. Users can enable or disable the policy and edit, clone, or create a new one.

Please review the policy list. There are default rules for artifact collection except Windows Yara Analysis and Windows Generic Artifact Collection. The current policies can be reviewed, and new ones can be added by accessing the policy management. Current policies can be used initially. YARA Analysis is explained in detail within the last part of this guide. For some policies like YARA/THOR Analysis, Generic Artifact Analysis; we have to configure or create them manually because they need to be specified very accurately. To collect Windows artifacts like Shim Cache, AM Cache, and Prefetch, please create a policy with the type "Windows Generic Artifact Analysis."

<figure><img src="/files/GOwwlzx9YuXS58ENT5tQ" alt=""><figcaption></figcaption></figure>


# 3. Configure Policies in the Group

Groups are used to assign policies to endpoints. Each machine separated into other groups depend on OS and usage type. By default policies are pre-configured in the default groups, but they can be modified. Also, users can create a new group and assign specific policies and machines to that group.

Go to "Rules & Policies" -> "Policy Management" -> "Group Management". Click on the "+ Create" button to create a new group and design the group policy with the required analysis types. Device assignments to the groups can be dynamic or static according to the users decisions.

<figure><img src="/files/l1jNI8UqVu5YrSgGraR2" alt=""><figcaption></figcaption></figure>

Users can assign the policies to the groups. In this easy deployment case, please define the default policies. Then click on the "Save" button below.

### Enabling/Disabling The Policies

Users can enable or disable policies under the "Rules & Policies" -> "Policy Rules". Also, it can be enabled or disabled directly from the policy itself.

<figure><img src="/files/i233vpYkwPhIoekjniM8" alt=""><figcaption></figcaption></figure>


# 4. Agent Deployment


# Active Directory Windows Agent Installation

## Option 1: Prepare the MSI Package

* Please navigate to "Settings & Reporting" -> "Deployment Settings" page.
* On that page, copy your tenant-specific URL parameter and then download the MSI (x64) installer.

**Note**: The URL parameter is tenant-specific. Do not share it outside your organization.&#x20;

## Option 2: Prepare the EXE Package

* Please navigate to "Settings & Reporting" -> "Deployment Settings" page.
* On that page download the EXE agent.&#x20;

**Note**: The agent is tenant-specific. Do not share it outside your organization

## Deploy Agent with Bat/PowerShell Script

* Please navigate to "Group Policy Managment" and create a new GPO under the OU.

<figure><img src="/files/9Zk5a77qyEdecOX7gEGA" alt=""><figcaption></figcaption></figure>

* The GPO name can be "CyberCyte\_Installation".

<figure><img src="/files/AYwHmXje6WFfF2MUH9Kc" alt=""><figcaption></figcaption></figure>

* Under the "Scope" -> "Security Filtering" add Domain Computers and Domain Users.

<figure><img src="/files/u0I4rLowP6HRVGvpariU" alt=""><figcaption></figcaption></figure>

* Right-click on the GPO and select "Edit".

<figure><img src="/files/JGL7X0RnAzY4P3SBuUEp" alt=""><figcaption></figcaption></figure>

* The "Group Policy Managment Editor" will appear. Please navigate to "Computer Configuration" -> "Policies" -> "Windows Settings" -> "Scripts (Startup/Shutdown)".

<figure><img src="/files/qjvgOBafGpiMHw2Yd0rE" alt=""><figcaption></figcaption></figure>

* Double-click on the "Startup" and add the script. The script can be .bat format or .ps1 format, it is optional. Please make sure the script location is under the default script path, e.g:“\\\dc01\sysvol\domain.local\scripts\install.bat”
* Also, please upload CyberCyte package under the default script path, same as the startup script. The script and the package should be in the same directory for proper installation.
* Click "Apply" and exit.
* Run "gpupdate /force" in CMD.

<figure><img src="/files/tZaNMLD9pfbiG60erZY5" alt=""><figcaption></figcaption></figure>

* The machines should get the policy after the next startup.
* For execution logs, please navigate to "C:\ProgramData\ ". The logs will appear after the startup script execution.

## Additional Configurations and Troubleshooting

* Please make sure the startup scripts are always wait by default:
* Please navigate to “Computer Configuration” → “Policies” → “Administrative Templates” → “System” → “Logon”
* Set “Always wait for the network at computer startup and logon” = Enabled.

<figure><img src="/files/IaEikrLIMm2re7X24joG" alt=""><figcaption></figcaption></figure>

<figure><img src="/files/FPRUhxvKRlatCZsSQgv8" alt=""><figcaption></figcaption></figure>

* We can edit the delegation if it is required Click on the GPO and navigate the Delegation section.

<figure><img src="/files/3BfXKy621UNqiOVeY58F" alt=""><figcaption></figcaption></figure>

* Click the advanced button. Then select the user, computer or group. Give the read permission. Read permission is enough.

<figure><img src="/files/I1HnlFVnhJlrxL5fiFam" alt=""><figcaption></figcaption></figure>

## Startup Scripts

* Bat script for exe formatted agent:

```
@echo off
setlocal enableextensions

set "SRC=\\<domain-name-eg-contoso.com>\<gp-startup-path>\<PM Installer Name>"
set "LOG=C:\ProgramData\CyberCyte_exe_uninstall_install.log"

echo [%date% %time%] START >> "%LOG%"

if not exist "%SRC%" (
  echo [%date% %time%] FILE NOT FOUND: %SRC% >> "%LOG%"
  exit /b 1
)

start /wait "" "%SRC%" --silent --reinstallOnProblem --install --versioncheck=true  >> "%LOG%" 2>&1
set "RC=%ERRORLEVEL%"

echo [%date% %time%] FINISH ExitCode=%RC% >> "%LOG%"
exit /b %RC%
```

* Bat script for msi formatted agent:

```
@echo off
setlocal enableextensions
set "LOG=C:\ProgramData\CyberCyte_msi_uninstall_install.txt"
set "MSILOG=C:\ProgramData\uninstall_install_log.txt"
set "MSI=\\<domain-name-eg-contoso.com>\<gp-startup-path>\<PM Installer Name>"

echo [%date% %time%] START >> "%LOG%"

if not exist "%MSI%" (
  echo [%date% %time%] MSI NOT FOUND: %MSI% >> "%LOG%"
  exit /b 1619
)

:: Agent will uninstall if agent is already installed, then install it again...
start /wait msiexec.exe /i "%MSI%" ^
  REINSTALL_ON_PROBLEM=true ^
  URL="URL" ^
  PROXY_URL= ^
  PROXY_USERNAME= ^
  PROXY_PASSWORD= ^
  /qn /norestart /l*v "%MSILOG%"

echo [%date% %time%] FINISH ExitCode=%errorlevel% >> "%LOG%"
exit /b %errorlevel%
```

* Ps1 script for exe formatted agent:

```
$ErrorActionPreference = 'Stop'

$SRC = '\\<domain-name-eg-contoso.com>\<gp-startup-path>\<PM Installer Name>'
$LOG = 'C:\ProgramData\CyberCyte_exe_uninstall_install.log'

function Log($t){
    "$((Get-Date).ToString('yyyy-MM-dd HH:mm:ss'))  $t" | Out-File -FilePath $LOG -Append -Encoding UTF8
}

Log 'Powershell Script Starting'

if (-not (Test-Path $SRC)) {
    Log "NOT FOUND: $SRC"
    exit 1619
}

try {
    Log "EXEC: $SRC --silent --uninstall --install --versioncheck=false"
    $p = Start-Process -FilePath $SRC -ArgumentList '--silent --uninstall --install --versioncheck=false' -Wait -PassThru -WindowStyle Hidden
    $rc = $p.ExitCode
    Log "FINISH ExitCode=$rc"
    exit $rc
}
catch {
    Log "EXCEPTION: $($_.Exception.Message)"
    if ($_.Exception.InnerException) { Log "INNER: $($_.Exception.InnerException.Message)" }
    exit 1
}

Log 'Powershell Script Finished'
```

* Ps1 script for msi formatted agent:

```
Start-Transcript -Path C:\ProgramData\PMService\uninstall_install_log.txt -Append
Write-Output "Powershell Script Starting: $(Get-Date)"
 
$msiPath = "\\<domain-name-eg-contoso.com>\<gp-startup-path>\<PM Installer Name>"
$installArgs = "/i `"$msiPath`" /qn URL=`"URL`" PROXY_URL=`` PROXY_USERNAME=`` PROXY_PASSWORD=`` /norestart RUN_UNINSTALL_SCRIPT=true UNINSTALL_OPTION=uninstallall"

try {
   $process = Start-Process -FilePath "msiexec.exe" -ArgumentList $installArgs -Wait -PassThru -WindowStyle Hidden
   Write-Output "Exit Code: $($process.ExitCode)"
   Write-Output "Installation finished: $(Get-Date)"
}
catch {
   Write-Output "Error: $($_.Exception.Message)"
}

Write-Output "Powershell Script Finished: $(Get-Date)"

Stop-Transcript
```


# Windows: Downloading and Deploying The Windows Agent

Please review the Windows agent parameters. They can be adjusted as needed. It is recommended that the default values be kept. Please go to "Settings & Reporting" -> "Deployment Settings", then click "Configure Management Module." The duration can be set lower for small-scale deployments.

<figure><img src="/files/bmSF4uZTX3GXydIxxJ1v" alt=""><figcaption></figcaption></figure>

<figure><img src="/files/tL2KUL85GAxuhtBtqPZv" alt=""><figcaption></figcaption></figure>

## The Windows Agent Settings

<table><thead><tr><th>Parameter</th><th width="295.3333333333333">Purpose</th></tr></thead><tbody><tr><td>Communication Interval</td><td>The agent and the portal communication interval. It is based on minutes.</td></tr><tr><td>In-Depth Search Interval</td><td>Agents can in-depth search on machines and this is the search interval. It is based on minutes.</td></tr><tr><td>Remediation jobs Interval</td><td>The time interval that the agent gets the remediation info. If there is any remediation job assigned to the agent, the agent will get this information in that interval. It is based on minutes.</td></tr><tr><td>Maximum Number of Active Data Collectors</td><td>The active number of parallel collections, a lower number means lower source usage and the default value is min 3.</td></tr><tr><td>Data Collection Servers</td><td>The Sensor address for collection of the data.</td></tr></tbody></table>

## The Package Manager Settings

<table><thead><tr><th>Parameter</th><th width="295.3333333333333">Purpose</th></tr></thead><tbody><tr><td>Update Check Interval (minutes)</td><td>The interval for the package manager to communicate with the portal to get and send the settings.</td></tr></tbody></table>

Other options are not recommended in this situation, so there is no information about them on this page. But the settings are clear to understand that most of them are intervals of each collection loop or specifying the artifacts.

Once the intervals are entered, click on the "Save" button. For small-scale testing, the parameters can be set to 5 minutes. The duration should be increased for larger-scale deployments.

Windows Threat Monitor Settings are specifically designed for monitoring process activity, honeypot accesses, file activity, and script executions. Default intervals should be like the image below, but please edit as per your system requirements.

<figure><img src="/files/r36SAKuWzpppWPXYgr3X" alt=""><figcaption></figcaption></figure>

<figure><img src="/files/LVvayVkt7xGNuFMukFYQ" alt=""><figcaption></figcaption></figure>

<figure><img src="/files/Jl2XUI0t0sMafTHWBEug" alt=""><figcaption></figcaption></figure>

<figure><img src="/files/LhyIlz5pl2by84jhZDgC" alt=""><figcaption></figcaption></figure>

## The Agent Deployment

Go to "Settings & Reporting" -> "Deployment Settings", then click on "Download". The executable Windows agent should be started after that. Once it is downloaded, click to run the executable, and when it is done, the machine data will be added to the portal.

Once the agent is deployed, please check initial data is being populated. Initial Sysmon data can take up to 15-20 minutes to be available within the system based on the configured parameters. Autoruns, processes, inventory data, and device information are available for Windows agents.

<figure><img src="/files/nUIgfTCT4Y7Ma3KSd9dQ" alt="" width="375"><figcaption></figcaption></figure>


# Linux: Downloading and Deploying  The Linux Agent

## The Agent Deployment

The Agent installer link is created dynamically when downloaded. Once the agent is downloaded, it is available from "Settings & Reporting" -> "Deployment Management".

<figure><img src="/files/VSZraGrt7AtWeT7TtyAC" alt=""><figcaption></figcaption></figure>

From this section, basic agent parameters can be configured by clicking the "Linux Agent Settings " button.

<figure><img src="/files/ohfGhpyHtCTZjSWIQLIa" alt=""><figcaption></figcaption></figure>

**Agent Configurations**

| Settings Name              | Explanation                                 |
| -------------------------- | ------------------------------------------- |
| Communication Interval     | Agent communication interval to the Server  |
| Data Sending Interval      | Agent data send interval to the Server      |
| Update Check Interval      | Agent update check interval from the Server |
| Service Iteration Interval | Agent sleeps for this time after each cycle |
| Upload Data Chunk Size     | Number of uploaded entries by one query     |

Once the settings are defined, click the "Save" button, and the system will redirect to the download page. Click the "Download Service Installer" button to download the agent.

It will redirect to a new tab, where a wget command is used to install and apply the agent's installation script. Please execute it on the servers and clients to install the agent.&#x20;

`wget --no-check-certificate -qO- "<URL>" | sudo sh`

Once the download button is clicked, it is created and signed.&#x20;

Note 1: Because of its nature, some EDRs or AV solutions may consider this installer file malicious. Please whitelist this file on your endpoint security products. Also, the services and processes below are deployed. It is recommended that you whitelist them.&#x20;

Services&#x20;

| Service Name            | Display Name                    |
| ----------------------- | ------------------------------- |
| cybercyte\_linux\_agent | cybercyte\_linux\_agent.service |

Installation of Agent &#x20;

After using the wget command, run the command at the endpoints to install the agent. &#x20;

After installing the agent, it automatically registers to the system.&#x20;

Checking Installation&#x20;

After the agent is installed, it registers itself automatically with the Server. Please go to "Endpoint & Network Devices" -> "Asset Management" -> "Endpoint Management" to see the agents. The device may take a couple of minutes to appear on this screen. &#x20;

<figure><img src="/files/PxAicS5ARiKM7vyAQi44" alt=""><figcaption></figcaption></figure>

Agents should be able to access CyberCyte Server on Port 443 and <https://download.cloudcyte.com> websites. If the agent is not shown here, please check access to the portal on the client first. If the entry is successful, please wait for communication interval settings.

## Adding Necessary Policies and Endpoints to the Linux Servers Group

&#x20;Once the agents are created in Endpoint Management, add them to the Linux Servers Group. Please navigate to "Rules & Policies" -> "Policy Management". Then, add the policy as in Figure 5. In some cases, you need to create the policy for this, following Figure 6. Finally, add the endpoint with a Linux-based Operating System (Figure 6). After a while, you will see the data from these endpoints.

<figure><img src="/files/s3Flw5x0n9uYHR8qaSTP" alt=""><figcaption><p>Figure 5</p></figcaption></figure>

<figure><img src="/files/arpMiZRdBqIGWMW9eSui" alt=""><figcaption><p>Figure 6</p></figcaption></figure>


# macOS: Downloading and Deploying The macOSAgent

## The Agent Deployment

The Agent installer link is created dynamically when downloaded. Once the agent is downloaded, it is available from "Settings & Reporting" -> "Deployment Management".

<figure><img src="/files/bwcMmOYf0R9mAsmXskoG" alt=""><figcaption></figcaption></figure>

From this section, basic agent parameters can be configured by clicking the "macOS Agent Settings" button.

<figure><img src="/files/9bUYefZZcsXM7iuYm2lC" alt=""><figcaption></figcaption></figure>

**Agent Configurations**

| Settings Name              | Explanation                                 |
| -------------------------- | ------------------------------------------- |
| Communication Interval     | Agent communication interval to the Server  |
| Data Sending Interval      | Agent data send interval to the Server      |
| Update Check Interval      | Agent update check interval from the Server |
| Service Iteration Interval | Agent sleeps for this time after each cycle |
| Upload Data Chunk Size     | Number of uploaded entries by one query     |

Once the settings are defined, click the "Save" button, and the system will redirect to the download page. Click the "Download Installer and Config" button to download the agent. This action will start to download the installer. The agent (.pkg) and the config file must be downloaded and they need to be in the folder. To install the agent, please double-click on the downloaded pkg file. The installation will start automatically. Alternatively, the below command can be used.&#x20;

```bash
sudo installer -pkg /path/to/package.pkg -target /
```

After installing the agent, the machine information can be seen under the "Asset Management" -> "Endpoint Management".

## Adding Necessary Policies and Endpoints to the macOS Devices Group

Once the agents appear in the Endpoint Management, add them to the Linux Servers Group. Please navigate to "Rules & Policies" -> "Policy Management" -> "Group Management". Select the group named "macOS Devices Group". Assign the policy to the required field and click on the "Save" button placed below on the page.

<figure><img src="/files/jHqhdJk7biCbkeGT17e6" alt=""><figcaption></figcaption></figure>

<figure><img src="/files/oKi91iHNqks6XF3Aqmlh" alt=""><figcaption></figcaption></figure>

In some cases, users need to edit/create a new policy. For a new policy please navigate to "Rules & Policies" -> "Policy Management" -> "Policy Rules" and click on the "+ Policy" button. Edit the field as needed and save the policy. After successfully creating a policy, go to "Group Management" and select the "macOS Devices Group". Assign the policy to the group.

<figure><img src="/files/KbBjahbUjx7ZrISdnIxs" alt=""><figcaption></figcaption></figure>

When policies are assigned to the groups, the data collection starts. Users need to wait for the next iteration of the collection to see the results.


# 5. Enabling Classification Rules

Query Based Classification and List Based Classification secitons are responsible for artifact classifications. On the portal classification rules and lists are executed with intervals ( the interval can be configured. ).

The lists and classification rules are enabled by default but they can be modified. Please navigate to "Rules & Policies" -> "Artifact Classification" -> "Query Based Classification" / "List Based Classification". Click on the three dots on the right side of the grid. Users can clone, edit, or create new rules on this page.

Searching for "Windows" and enabling all of them is initially recommended.

<figure><img src="/files/YK4E1acsgZQa1GxlK7ZB" alt=""><figcaption></figcaption></figure>


# 6. Review The Results & White Listing

Agent deployment is completed. Go to "Analysis & Investigation" -> "Artifact Analysis". Please check the autoruns, processes, sysmon analysis and etc. There can be items flagged as malicious, critical, or high risk. In case they are false positives, they can be added to the white list to enable trust. Any property of an artifact can be used to exclude it from analysis. By default, a white list is available. They can be added as detailed below.

<figure><img src="/files/fo0daPyzFtjvGsDnKuqM" alt=""><figcaption></figcaption></figure>

Right-click on the entry and select List Management. Users can choose the list option as they need. When entries are listed, go to "Rules & Policies" -> "Artifact Classification" -> "List Based Classification". This page shows the listed entries; it can be edited. Click on the three dots right side of the grid and choose the option.

<figure><img src="/files/q28vsCIWMVqAfgaxWULD" alt=""><figcaption></figcaption></figure>

White / Black listing is recommended, but users can use classification rules to customize the actions as well.


# 7. Reviewing and Enabling Sigma Rules

Once the sysmon data is collected, go to "Rules & Policies" -> "SIGMA/YARA Rules" -> "SIGMA Rules". Click on the three dots left side of the grid, select "Enable All Rules Displayed" and then select "Force Run All Rules Displayed". It is recommended to enable the rules after one day of sysmon collection.

Go to "Analysis & Investigation" -> "Hunting Settings" -> "Asset & Threat Analysis Settings" -> "Threat Detection Rules Run Interval (Hour)". Users can change the run interval and edit the next run time. Be sure to click the save button after editing.

<figure><img src="/files/9v6o8ICmtibszbnVGnHd" alt=""><figcaption></figcaption></figure>


# 8. Generating Reports

Go to "Settings & Reporting" -> "Reporting". Click on the "+Report" button or click three dots on the right side of the grid to edit the default report.

<figure><img src="/files/qXPqeKCtLZdNwYqtgCne" alt=""><figcaption></figcaption></figure>

With "+Report" and "+Text" buttons, users can add or remove specific results. Also, users can change the sender information too.

<figure><img src="/files/1PYaU5n9YHl5NStXAnVa" alt=""><figcaption></figcaption></figure>

The "+Report" button shows the list of the analysis type. Some options are shown down below.

<figure><img src="/files/zLyMXe2U40GZExZZQM3W" alt="" width="432"><figcaption></figcaption></figure>

Define which user(s) or group(s) will get this report by email. If they are already defined on the portal, they will get the e-mail otherwise they just added and waiting for the confirmation.

<figure><img src="/files/ZHwtoK1oqosSeLW6x8b5" alt=""><figcaption></figcaption></figure>

Change the header logo and footer if needed.

<figure><img src="/files/rVQYNb68u7mJnS1aW8y7" alt=""><figcaption></figcaption></figure>

Click on the "Reload" button to see the final form of the report. Click on the "Save" button.

<figure><img src="/files/JCXvkjakB3nwfV41KNp8" alt=""><figcaption></figcaption></figure>

Click on the three dots on the right and click on "Schedule Report" and after that "Generate Report". Schedule the report by editing intervals. Click on the "Send Now" button. Users will get the report by e-mail.

<figure><img src="/files/74JmE6ezZaXEQ27KUL8i" alt=""><figcaption></figcaption></figure>


# 9. Notification Settings

Notifications can be configured and assigned to classification rules. To access notification settings, please go to "Settings & Reporting" -> "Notification Settings" -> "Notification Parameters". By default, Twilio SendGrid is used to send the e-mails. A custom e-mail server can be configured from "Settings & Reporting" -> "Organization settings" -> "Mail Server".

<figure><img src="/files/dkRMe3yZRg6xYgdZRLeY" alt=""><figcaption></figcaption></figure>

<figure><img src="/files/UYuoIox6DoV8zNVDKUR9" alt=""><figcaption></figcaption></figure>

The second step is to configure the notification parameters. The parameters can be configured for each notification type. The notification parameters are configured through "Settings & Reporting" -> "Notification Settings" -> "Notification Parameters". Please click "+ Notification Setting" to configure the notification parameters.

<figure><img src="/files/2rzmZSVhW9yMd1xSqvQz" alt=""><figcaption></figcaption></figure>

Once the notification parameters are configured, define the notification messages under the "Notification Setting Templates" section. The templates are assigned to "Classification Rules" with the type "Notify". To customize a template, please click the "…" button, select clone, and edit the template. Through the "…" button, the template is assigned to the classification rules where an alert is to be generated.

<figure><img src="/files/UQuG6mVnkCAkmUeSjAQs" alt=""><figcaption></figcaption></figure>

<figure><img src="/files/eb0MZE5TmuAEQ8z2WRO5" alt=""><figcaption></figcaption></figure>

<figure><img src="/files/OJQd4lOaxaOfArkdDKCc" alt=""><figcaption></figcaption></figure>

Through classification rules, the notification messages can be customized further under the "Rules & Policies" -> "Artifact Classification" -> "Query-Based Classification".

<figure><img src="/files/IJNLBELyL8pGqsFgVBEe" alt=""><figcaption></figcaption></figure>


# 10. YARA Analysis & THOR

The platform is using THOR for YARA analysis. Please add your Thor license file under the Thor policy. Please go to the Rules & Policies -> Policy Management -> Policy Rules, click on the "+Policy", select SIGMA & YARA module and select Windows YARA/THOR Lite Analysis or Windows YARA/THOR Analysis.

<figure><img src="/files/0ErxmIRJGita71u1BIPO" alt=""><figcaption></figcaption></figure>

Both Thor Lite and Thor Professional are supported. Once the license is added, please create a policy for THOR Analysis and assign the created license. The initial policy interface is configured for the recommended settings.

<figure><img src="/files/HqEIP6UZIoXBOlSa7CiL" alt=""><figcaption></figcaption></figure>

<figure><img src="/files/l34P2DS0JhMzl5FYKDjt" alt=""><figcaption></figcaption></figure>

<figure><img src="/files/BgYDdxk8VhIdVm09Rrd4" alt=""><figcaption></figcaption></figure>

Click on the "Save" button. Once the policy is created, please assign it to a group.

Click on the three dots and click edit.

<figure><img src="/files/5amsofyOC0gQihURuOWc" alt=""><figcaption></figcaption></figure>

Assign THOR policy to the group.

<figure><img src="/files/NEjFZDzkdg12rmqq0zuz" alt="" width="375"><figcaption></figcaption></figure>

The initial data will take 6-24 hours to be collected.


# 11. Configuring YARA Rules

YARA scan will create false positives; the system identifies the file signer for each alert. THOR/YARA classification rules have a built-in global rule for whitelisting based on signer information. Clone the rule and add new trusted signers to minimize the false positives. To access classification management rules, please go to the "Rules & Policies" -> "SIGMA/YARA Rules" -> "Windows YARA Rules".


# 12. Remediation Management

Remediation actions can be performed seamlessly. Remediation management can be accessed under the "Response Management". Also under the "Security Assurance" -> "Hardening & Conf. Management" section is all about hardening benchmarks, users can remediate the failed controls by right-clicking and selecting the remediation option or clicking the "Remediate" button on the top side of the grid, this option allows users to take bulk actions. After assigning the remediation tasks, please navigate to "Response Management" -> "Windows Remediation" -> "Windows Remediations Logs". On that page, users can see their assigned remediation jobs, remediation summary, remediation logs and remediation functions. (Also, users can write their custom remediation actions to execute the machines.)

<figure><img src="/files/BJHVemlT6bnCR5iBN0uY" alt=""><figcaption></figcaption></figure>


# 13. Results of The Analysis

Once the artifact data is collected, please go to "Most Used" -> "Welcome". The results can be seen with the selection of the analysis. All the remediation actions also can be applied in these grids. The system always tries to remediate security gaps, malicious activity and vulnerabilities.

<figure><img src="/files/5kyfOYytag3Em2YPWgTS" alt=""><figcaption></figcaption></figure>


# Using the Main Dashboards and Grids

<figure><img src="/files/NIF1paSAacxxeyMJ9jOq" alt=""><figcaption></figcaption></figure>

The "Welcome" -> "CISO Dashboard" provides a maturity score based on the findings on the portal, activities on the machines and also their current state and finally summary of artifacts based on severity levels. The artifacts requiring investigation are classified into four categories: Malicious, Critical, High Risk, and Unknown. The artifacts can be analyzed more thoroughly through the "CISO Dashboard" page by clicking the artifact name or the hit count values. The detailed grid is opened accordingly. Through the dashboard, artifact summary section provides the summary of the all the artifacts on the portal.

<figure><img src="/files/R9Ol8khFJ8lNZMVMHK3e" alt=""><figcaption></figcaption></figure>

The "Artifact Summary" section display current state of the system. When the artifacts are classified, the users can anaylze the findings with just one click. The navigated page will display all the artifacts collected on the devices.

<figure><img src="/files/qV04oRtVRouXJMNImkha" alt=""><figcaption></figcaption></figure>

The artifact grids are used to perform detailed analysis and investigation. On the top part of the page, hit counts based on severity are provided. On the grid, right-click actions provide the core functionalities. Both through the grid header and body, right-click actions are available. When clicked from the grid header, bulk operations can be performed:

* Rule Management: An artifact property can be added to a new or existing classification rule.
* List Management: An artifact property can be added to a list.
* Application Control Management: An artifact property can be added to a list.
* Aggregate: Aggregation actions can be performed.
* Actions:  Through actions, the details of the artifact can be displayed. An artifact can be flagged as malicious or as trusted. When set as trusted, the risk score value is 0, and the malicious flag is set to false.
* Acknowledge: An artifact can be acknowledged for filtering in the grids.
* Search: The artifact property can be searched in Google and Virus Total.
* Enrichment Details: The information retrieved from threat intelligence is displayed in a pop-up.
* Host Analysis: The details of the host where the artifact is identified are displayed.
* Windows In-Depth Analysis: For Windows Autoruns, Processes, and Sysmon, an in-depth investigation of process behavior can be performed through a visual map.
* Remediation: Remediation jobs can be triggered.
* Remove: The artifact is removed from the grid when selected.
* Edit: The artifact properties can be edited.

<figure><img src="/files/3OOgAVt5qwp2JVmYmOVq" alt=""><figcaption></figcaption></figure>

&#x20;On the top part of the grid, the main analysis and search functions are available as detailed below:

* Aggregate: The system provides two different aggregation analyses. In one type, the result is displayed as a pop-up. Through the pop-up, selected or all items can be added to classification rules and lists. The property is applied as a filter when clicked on the count values. Right-click actions are also available in the pop-up. In the second aggregation type, the results are displayed on a separate grid with full support of grid functionalities.
* "…":  Bulk actions for the active artifact are displayed through this menu. Classification rules or updated list rules can be triggered to view the most up-to-date artifact classification state.
* Windows Remediation: For all the displayed items in the grid, remediation jobs can be triggered.
* Linux/macOS Remediation: For all the displayed items in the grid, remediation jobs can be triggered.
* Filter: The grid provides a detailed filtering function. A detailed filtering menu is opened on the right when the filter icon is clicked. After the filter is created, it can be saved by clicking the green icon on the top right part of the grid. Active filter can also be deleted. The saved filters can be selected from the "Select Filter" dropdown.
* Export: The items on the grid can be exported from this part of the menu.

The "Infrastructre Health" dashboard displays the current state of the infra health based on the findings on the devices. With clicking the dashboards, they will navigate user to the related artifacts. The dashboard is designed for users whole system detailed visualization. These dashboards specificly visualize the accesses on the system, like "Windows Network Access by Object Name", "Windows Network Access by Hostname", etc...

<figure><img src="/files/3gduSuSmjxk8GkHaRoIo" alt=""><figcaption></figcaption></figure>

The "Host Summary" section displays a summary of the host analysis. This grid allows users to see the machine's health state with different types of scoring.

<figure><img src="/files/qiKDnCJu7gHbVCtljT5S" alt=""><figcaption></figcaption></figure>

The "Activity Summary" focusing the organization's activty history with a summary of all threats. The users can analyze their situation, and with that users can see the activities and take action on the portal, such as white-listing, remediations, etc...

<figure><img src="/files/bBDJ6EEXtiMhhMoInvdb" alt=""><figcaption></figcaption></figure>

The EDR/DLP Assessment dashboards are designed for visualizing the EDR and DLP assessment coverage. On the users system, they can see percentage of the coverage and coverage details.

<figure><img src="/files/EymmanN1BwXeXjNa5vFm" alt=""><figcaption></figcaption></figure>


# Classification Rules

The Classification Engine is a core component of the platform. Any property of an artifact can be set by using the classification engine. Classification rules and lists are used to set the properties of the artifacts. When setting the value of a  property, any value of the artifact can be used for matching.

<figure><img src="/files/l8zGUG96FYmNWRIVeT9F" alt=""><figcaption></figcaption></figure>

All artifacts have common properties. They are used to provide a common analysis and classification infrastructure.

* Risk Score is between 0-100, indicating the risk level. For unknown artifacts that the threat intelligence analysis cannot identify, a score of 70 is set. Values greater than 90 are critical, values between 70-90 are high risk, and values between 33-70 are set as medium risk.
* The "Is Malicious" property flags artifacts as malicious based on threat intelligence or artifact analysis results.
* "Classification Rule Name"  is used to identify which classification rule matched the artifact.
* "Classification State" identifies if an artifact has been classified.
* The "Is Acknowledged" flag enables the security teams to separate artifacts based on whether they have been investigated.

<figure><img src="/files/0c47hiastHCq1wOwaZ45" alt=""><figcaption></figcaption></figure>

The platform provides default built-in classification rules and lists for all collected artifacts. Classification rules are accessed from the "Rules & Policies" -> "Artifact Classification" -> "Query Based Classification" menu. Classification rules can be filtered through the top right search or the dropdown selector in the middle. Global rules are read-only. They can be cloned and modified using the "…" button. There are four types of classification rules:

* Default is the classification rule which is used for setting the artifact properties.
* The "Notify on Match" rule type is used to execute notifications. They are executed after classification and list rules.
* The "Notify if no Match" rule type executes notifications when a specific artifact is not found. They are also executed after classification and list rules.
* The "Scenario Rule" rule type is designed for specific scenarios.

Adding an artifact property to lists for flagging as trusted or malicious by default is recommended. Each list sets the global artifact properties(Risk Score, Is Malicious, etc.). By default, Malware, Black, and White lists are available. List types can be accessed from List Management -> "…" -> List Types Management. To add a property to a list, right-click on any grid. From list management actions, the property can be added to any list. Adding wildcards or the hash value is also supported.

Classification rules should be used when it is necessary to perform the classification using multiple properties. Classification rules can set artifact properties, send notifications, and execute response actions. The system provides default responses like terminating a process or deleting a file. Additional responses can be configured using PowerShell commands or scripts. To add a property to a classification rule, right-click on any grid. From "Rule Management," the property can be added to a new rule, or the values can be appended to an existing rule. Adding wildcards or the hash value is also supported. When creating a new rule, assign a name and set a priority of execution. The highest valued items are executed last, making it a higher priority.

Classification rules consist of three major parts:

* Match Conditions: Match conditions are used to match the artifact properties. Once the artifact property is chosen, different conditions can be used to match a property value. The "Is One of" condition provides a detailed filter in which multiple values can be added seamlessly.

<figure><img src="/files/PyRmDq5zdzYbY6nPSuAd" alt=""><figcaption></figcaption></figure>

* Set Property Values: Any values of the artifact can be updated. It is typically used to assign a risk score, whitelist, or set an artifact as malicious.
* Notifications: Notifications and response actions are added through this section.

<figure><img src="/files/ZK2GYwreMjyZvqFhfaJT" alt=""><figcaption></figcaption></figure>


# Configuring Modules


# Threat Hunting

Threat Hunting module provides a service to find malicious activity or settings in your infrastructure.  It is integrated with the Broker module. The Sensor module collects information based on policies defined, and the Threat Huntering module runs analysis rules on collected data to catch malicious activities.


# Enabling Windows Autoruns & Process Analysis

The AutoRun Policy collects autorun and processes information from client devices by leveraging WinRM (Windows Remote Management).

To define an autorun policy, go to "Rules & Policies" -> "Policy Management" -> "Policy Rules and click the" -> "+Policy" button.

On the policy definition screen, set values for the policy you are defining, Name, Description, Severity, and Enable status.

You can select notification action on the additional settings if something unusual is detected. Also, you can enable/disable CloudCyte cloud-based  intelligence  check by using "Enable Investigation Mode."

The system also queries Virus Total for the files it finds. you can enable it from the "Virus Total Integration" section.


# Enabling Weak SNMP Discovery

The Weak SNMP Policy finds predefined SNMP v1/2 string information from client devices.

To define a weak SNMP policy go to Rules & Policies -> Policy Management --> Policy Rules and click the "+Policy" button.

On the policy definition screen, set values for the policy you are defining, Name, Description, Severity, and Enable status.

The important part of this policy is the "Community Name" part. System search for these SNMP strings on client devices.&#x20;


# Enabling Linux Analysis

The Linux analysis currently updating, when the module is updated this section will be updated as well.

~~Linux analysis enables full visibility of Linux systems. The Linux analysis module discovers activities inside a Linux system by collecting and analyzing processes running, user creation, commands executed, login activity, and scheduled entries.~~

~~To enable Linux Analysis:~~

1. ~~Define an SSH user who has root privileges on Linux systems by navigating  Settings & Reporting --> Credential Settings --> Remote Credential. Click  "+Credential," and define the credential as shown below.~~

<figure><img src="/files/JdmDqvT77ANvlr5PZmd7" alt=""><figcaption></figcaption></figure>

<figure><img src="/files/SYR7OfWtmAYoEtYVWdRK" alt=""><figcaption></figcaption></figure>

{% hint style="info" %}
~~Use for enumeration should be enabled for this user to enumerate discovered devices as Linux. Discovered devices are automatically classified as Linux if a defined SSH user can connect them.~~
{% endhint %}

~~2.  To enable the Linux Analysis policies, go to Policy & Rules -> Policy Management --> Policy Rules. Click the "+Policy" button, and select Module  as "Linux Artifacts" and Event as "Linux Discovery."~~

<figure><img src="/files/RJY1DSdmFfV92KuJpYj9" alt=""><figcaption></figcaption></figure>

~~3. Bind the policy to the group to activate your policy. Go to  Policy & Rules -> Policy Management -> Group Management and select the group for editing and bind the policy.~~

<figure><img src="/files/AH1xk5L9wrCM0Eua5qRp" alt=""><figcaption></figcaption></figure>

<figure><img src="/files/foyIcu0NS9EPmdX23GER" alt=""><figcaption></figcaption></figure>

~~The system automatically activates the policy, and information from Linux devices is collected at every interval defined in the policy.~~&#x20;

~~4. To analyze the collected information from Linux devices, go to Threat Hunting --> Analysis & Investigation and select one of the Linux-related menus from the top of the page.~~

<figure><img src="/files/ULcgFgAowwgKA9KTHqRV" alt=""><figcaption></figcaption></figure>


# Job Management

Job management enables the removal of artifacts for AutoRuns and Process Analysis.

A job can be terminating a process, deleting a process file, or cleaning autorun entries.&#x20;

To define a job:

1. Go to "Analysis & Investigation" -> "Artifact Analysis" and select any kind of artifact. Select one of the entries and right-click on it. On the menu, select remediation menu and execute one of the available actions for that entry.

2\.  Go to "Remediation & Response" -> "Windows/Linux Remediation" -> "Windows/Linux Remediation Jobs" to view the job status and history of action taken by the system.

<figure><img src="/files/QCAqgfq7Q8zivVCzF1Ex" alt=""><figcaption></figcaption></figure>

<figure><img src="/files/woLxCAZ54oCbgNOs9umk" alt=""><figcaption></figcaption></figure>


# Customizing Classification Rules&#x20;

Classification rules are the core engine of the platform. Every collected piece of information is classified, tagged, and enriched by the classification rules. The platform provides built-in rules as a template. The rules can be customized by cloning them. The built-in rules are read-only.

Classification rules are accessed from Rules & Policies -> Artifact Classification -> Query Based Classification. The rules can be filtered through the selector on the top-middle section of the primary grid.

The “…” button on the right “+ Rule ” button provides ease-of-use options for enabling/disabling rules, immediate execution, and import/export support.

<figure><img src="/files/a2hN6ySGCi0nZmNQRs3H" alt="" width="296"><figcaption></figcaption></figure>

A rule can be cloned by clicking the “…” button. Once cloned, the rule can be customized.

<figure><img src="/files/hVSkFnq3irfgcQpeCrzX" alt="" width="133"><figcaption></figcaption></figure>

The main properties of a rule are as follows:

<figure><img src="/files/RAKioIhxNQOoPGw666S3" alt=""><figcaption></figcaption></figure>

**Rule Type:** there are few kinds of classification rules:

**1. Classification Rule:**  This is the default rule type.

**2. Asset Categorization Rule:** This rule designed for categorising the assets.

**3. Notify on Match:**  When this rule type is selected, notifications can be executed based on a match condition.

**4. Notify on Non-Existence:**  When this rule type is selected, notifications can be executed based on a match condition.

**5. Threat Intelligence:**  This rule only trigerred based on thread intels response.

**6. Scenario Rule:**  This rule only trigerred when specidifc scenario is happened.

**Priority:** Higher values override the flags set in the previous rules.

**Origin:** It can be global or user-defined.

**Status:** It can be enabled or disabled.

<figure><img src="/files/FPwEXUr6IDUuTotBNhXO" alt=""><figcaption></figcaption></figure>

Once a rule is opened for editing, detailed options are provided for configuration:

**Artifact Type:** The type of artifact the rule will execute. The “All Artifacts” option is available for executing a rule on all artifacts.

**Rule Type:** Rule types are explained previously. When Notify on Match or Notify on Non-Existence rule type is selected, notification actions are available.

**Rule Priority:** Higher values take precedence. A priority number can be generated automatically by clicking the button to the right of the property.

**Name:** Name for the rule.

**Description:** Description of the rule.

**Recommendations:** Reccomendation for the rule execution.

**Stop Rule if Existing Risk Score is Higher:** When a rule is executed, it can be stopped if it matches an artifact with a higher risk score.

**Status:** Used for enabling or disabling a rule.

**KPI:** When enabled, the number of matches to the rule is recorded as a KPI value for historical analysis.

**Create Notable Event:** When enabled, the artifacts will be appeared under the notable events table on the portal.

**Expiry Date:** If the rule should exist for a while, users can assign expiry date.&#x20;

**Only Process Records Updated:** The rules can be set to be executed on artifacts identified at a specified time interval. For rules executing notification actions, it is recommended to select an interval. A value of the last 12 hours is recommended for notification actions.

**Check per Group of:** The field for checking the computer name and device ID.

**Match Condition**s: Any parameter of the artifact can be used to create match rules. When creating match rules, a filter is provided to display artifacts based on risk level to enable easier management. Any unclassified artifact can be added to match the configured rule and enable classification.

**Aggregate Conditions**: The options for aggregation of notifications.

**Notifications:**  Notifications can be created from these sections. <mark style="color:orange;">When Notify on Match or Notify on Non-Existence rule type is selected, notification actions are available</mark>. Notifications can be configured based on match conditions by adding notification actions.

A classification rule consists of two main parts for  selecting and updating artifact information

**Match Conditions:** The rule is triggered based on the artifact properties matched. Any property of an artifact can be used for matching.

**Set Property Values:** Once a rule matches an artifact, the artifact properties are set through set property values. Risk Score, Investigation State, Category, and “Is Malicious” are some of the properties.

<figure><img src="/files/KfxoOCr8tCQZ7nQzE7PV" alt=""><figcaption></figcaption></figure>

**Artifact Format**

Every information collected by the platform is normalized and enriched. Common attributes are also added to enable better classification, as detailed below:

**Risk Score:** A value between 0-100 can be set. Higher values indicate a bigger risk. Values between 0-33 are classified as low risk, 34-66 are classified as medium risk, and values between 67-100 are classified as high risk.

**Tags:** Tags are used to create a standard definition for collected information. It is possible to add tags as needed.

**Classification State:** The classification state tracks if a collected artifact matches a classification rule. It can have the following values:

&#x20;  \- Classified Manually

&#x20;  \- Classified by Intelligence Database

&#x20;  \- Matched a Rule

&#x20;  \- New Entry

&#x20;  \- No Matching Rule

**Classification Category:** This property can be used to categorize collected artifacts.

**Investigation State:** When set to “Investigation Request,” anonymous artifact information is shared with the threat intelligence system for investigation. It is recommended to set it to “Investigation Request” through the rules for unknown or high-risk artifacts.

**Is Malicious:** This flag is set to true for artifacts detected as malicious

<figure><img src="/files/bnFJjpAyHNHgr7kFsJgC" alt="" width="375"><figcaption></figcaption></figure>

The property values and types can be change based on the artifact properties.

{% hint style="info" %}
Hints:

·       Use the classification rules to select the artifacts permitted within the organization. Once the rules are configured, unknown artifacts will be highlighted. Built-in rules can be used to extend the trusted artifacts. Each rule type contains a rule for this purpose. The rule can be cloned and extended.

·       The system performs analysis through threat intelligence platforms to identify unknown and malicious artifacts. Built-in rules are available for automated classification based on threat intelligence.

·       Unknown files not matched by threat intelligence set a risk score of 70 for high risk. It is recommended to review artifacts having a high-risk score.

·       For Windows, Autoruns and processes match conditions based on company and signature can be used to minimize unclassified artifacts
{% endhint %}


# Enabling Windows Event Log Analysis&#x20;

On this page, please request access to SUPERORG from your administrator, organization users are not allowed to access other organizations.

Windows Event Log Analysis is performed with or without agents. Enabling Window Event Log Analysis is achieved through several steps.

1. Initially, the Elastic server connection setting should be set from the SUPERORG settings for on-premise deployments. Please switch to MSSP, configure the Elastic username and password. By default, Elastic uses port 9200. For this process please communicate with CyberCyte support team.

2\. From "Rules & Policies" -> "Artifact Collection Parameters" -> "Windows Event Log Rules" menu, rules for collecting logs are configured. The rules specify the filter to be executed for log collection. The filter is executed, and the matched records are sent to Elastic for initial storage.

3\.   Windows Event Log rule consists of the below sections for configuration:

a.     Name: The name given to the rules.

a.     Description: An optional description is provided for the rule.

b.     Channel: The log type to be collected from the endpoint.

c.      Filter:  Xpath is used to define the filter options. \[TimeCreated\[@SystemTime >= #{last\_collection\_time}] must be included in the filter. #{last\_collection\_time} is a variable used by the platform to track the last execution time and execute queries effectively. More information on Xpath is available from <https://powershell.org/2019/08/a-better-way-to-search-events/> page. &#x20;

d.     Tags: For matched events, a tag can be added.

e.     Mitre Technique: A value for mitre technique can be added for matched events.

f.      Risk Score: For matched events, a risk score can be set.

g.     Labels: For matched events, a label can be added.

h.     Is Malicious: For matched events, the malicious flag can be set

4\. Once the rules are configured, a policy should be created to select which Windows Event Log rules will be executed for collection. Create a policy from "Rules & Policies" -> "Policy Management" -> "Policy Rules" with the type "Windows Event Log" Analysis. From the policy settings, set the time interval for log collection and the rules for collection.

5\. The final step is to assign the policy to the groups. From "Rules & Policies" -> "Policy Management" -> "Group Management" settings, choose the created policy. The group members will retrieve the policy and start the log collection.


# Enabling Windows Sysmon Analysis&#x20;

On this page, please request access to SUPERORG from your administrator, organization users are not allowed to access other organizations.

1\. Initially, the Elastic server connection setting should be set from the SUPERORG settings for on-premise deployments. Please switch to MSSP, configure the Elastic username and password. By default, Elastic uses port 9200. For this process please communicate with CyberCyte support team.

2\. From "Rules & Policies" -> "Artifact Collection Parameters" -> "Windows Sysmon Rules" menu, rules for collecting logs are configured. The rules specify how sysmon logs are collected. Sysmon log collection takes place through a sysmon configuration file. The rules in this section are used to construct the configuration file. Based on the rules in this section, policies are used to define which sysmon rules will be used to enable sysmon log collection. The system provides built-in rules for sysmon collection. The “…” button allows the cloning of a rule for customization. It is recommended to clone the rules for modification. A new rule can be created by clicking the “+” button.

{% hint style="info" %}
A sysmon configuration file consists of inclusion and exclusion rules. Inclusion rules define the information to be collected, and exclusion rules define the ones to be excluded. For more information on the fields and their usage for managing sysmon, please refer to the  <https://learn.microsoft.com/en-us/sysinternals/downloads/sysmon> website.
{% endhint %}

3\. A sysmon rule consists of the below sections for configuration:

a.     **Events:** The sysmon events the rule will be applied. A rule can be used for different events for inclusion or exclusion.

b.     **Name:** The name given to a rule.

c.     **Description:** An optional description is given to the rule.

d.    **Filtering Level:** An optional value to specify the filtering level for the rule can be configured. This value is used to group rules for easier separation.

e.     **Condition:** Conditions for the rules are defined in this section. The selector can be used to add a condition. The rule is edited using the edit button. It is also recommended to expand the rules for easier editing/viewing with the expand button.

f.      **Type:**  A rule can be used for inclusion or exclusion and is configured using the type parameter.

{% hint style="info" %}
When the sysmon configuration file is created, rules define for which events the rules will be valid. By creating a structure where one rule is applied to different events, One rule can be used to determine the inclusion/exclusion conditions based on shared properties.
{% endhint %}

4\. Through the sysmon analysis screen accessed from "Analysis & Investigation" -> "Artifact Analysis" -> "Windows Sysmon Analysis/Windows Sysmon Threat Analysis", sysmon rules can be modified. The right-click action on the value to be added enables the direct addition of a log property to the rule. Right-click -> "Sysmon Rules Mgmt." -> "Add to Image & Network Access Exclusions" action is used to add the value to a sysmon rules.

5\. When sysmon is enabled, the system deploys the sysmon service with specific configuration parameters. It is recommended to leave them with the default settings but it can be changed from the "Analysis & Investigation" -> "Artifact Analysis" -> "Hunting Settings" -> "Agent & Sensor Settings".

6\. Once the rules are configured, a policy should be created to select which Sysmon rules will be used to construct the Sysmon configuration file. Create a policy from "Rules & Policies" -> "Policy Management" -> "Policy Rules" with the type "Windows Sysmon/Threat Analysis" available from "Windows" -> "Windows Sysmon/Threat Analysis" selectors. From the policy settings, set the time interval for log collection and the rules for config file creation. The policy “Exclusion Filters” can also be used to exclude specific logs from collection through a string match. “,” can be used to specify multiple string values.

7\. The final step is to assign the policy to the groups. From "Policy Management" -> "Group Management" settings, choose the created policy. The group members will retrieve the policy and start the log collection.

8\. The Agent or broker will install the Sysmon service and apply the configuration file for collection.


# Enabling Windows Thor Analysis

Initially, the first step is to go to "Settings & Reporting" -> "Integration Settings". After that, click "Thor License Management". This page allows Thor License file definitions. Click on the "+License" button.

A little modal will open. Choose the license type with two options; "Thor" or "Thor Lite". Define the license type and click on to save button.

<figure><img src="/files/dQx8LLiLPxb9Xy7kkrjX" alt=""><figcaption></figcaption></figure>

After adding a license, create a "Windows Thor Analysis Policy". Go to the "Rules & Policies" -> "Policy Management" and "Policy Rules". On this page, click the "+Policy" button to create a new policy.

On the new policy page, choose the module and type. Select "SIGMA & YARA", and choose between "Windows YARA/Thor Analysis" or "Windows Thor Lite Analysis". Give a name to the policy. The description is optional.

Select the Thor license that was created. After selecting the license, change the collection interval. The default value is 30 minutes. Then set "Collection Time Intervals", which means the policy will run between the interval. Please choose the collection frequency, the system can run this policy always, once a day, week, or month. It is recommended to run weekly.&#x20;

Please choose info, notice, warning, and alert options in the "Minimum Collection Level". With these options, the system can send the Thor logs for the specified level. The system can run only selected modules. Up to five modules should be selected.&#x20;

Select the quick mode for faster scanning. The "Get Shim Cache" option is optional. Users can add custom commands on "Custom Command". Finally, click on the "Save" button.

<figure><img src="/files/HqEIP6UZIoXBOlSa7CiL" alt=""><figcaption></figcaption></figure>

<figure><img src="/files/l34P2DS0JhMzl5FYKDjt" alt=""><figcaption></figcaption></figure>

<figure><img src="/files/BgYDdxk8VhIdVm09Rrd4" alt=""><figcaption></figcaption></figure>

Now add this policy to the policy group. Go to "Group Management" under the "Rules & Policies" -> "Policy Management". On the grid, the system has a base group, click on the three dots right side of the grid and click on edit.

<figure><img src="/files/0ErxmIRJGita71u1BIPO" alt=""><figcaption></figcaption></figure>

Scroll down and find the "Thor Policy". Select the policy just created. Scroll to the bottom of the page and click on the "Save" button.  It is possible to see the results on the "YARA/Thor Analysis" grid under the "Threat Hunting" -> "Analysis & Investigation" module. Use classification rules to eliminate the false positive items.


# Enabling Windows Security Benchmark Analysis

This section is dedicated to creating a new policy for "Benchmark Analysis", in the default groups all the necessary policies are active and selected.

The first step is to create a policy. From "Rules & Policies" -> "Policy Management" -> "Policy Rules" and click on "+Policy" to create a new policy.

<figure><img src="/files/0ErxmIRJGita71u1BIPO" alt=""><figcaption></figcaption></figure>

Select the module and type. Give a name for the policy and set the "Collection Interval". The default interval is 30 minutes. After the initial execution, the policy interval can be set to a value of 1440 minutes. The description is optional. The last step of the policy is the selection of the benchmark(s).

<figure><img src="/files/Nhu9XOVARV2GCSa8Y7Ig" alt=""><figcaption></figcaption></figure>

Then apply the policy from the "Group Management" settings. There is a default group in which all new agents are enrolled automatically. Click the three dots on the right of the grid and edit this group. Navigate on the page, select the "Windows Security Benchmarks" and click save button.

The final step is to enable the classification rules. Navigate to the "Rules & Policies" section on the left menu, go to "Artifact Classification" and search "Benchmark". Click three dots on the upright on the grid and click "Enable All Rules Displayed". When you enable the rules, you should see gray circles turn to green on the status column. After enabling all the rules displayed, click the three dots again and click "Force Run All Rules Displayed". This action will force rules to run immediately.

<figure><img src="/files/WKbuqXhaGg1MJJtUCOeR" alt=""><figcaption></figcaption></figure>

The collection and classification results can be observed from Security Assurance -> Hardening & Configuration Management.

<figure><img src="/files/nKaUIjht3FfvqRKeey5e" alt=""><figcaption></figcaption></figure>


# Enabling In-Depth Analysis

The CyberCyte portal provides built-in policy rules, but some policies need to be specified manually for accurate analysis. For that, users need to configure object and honeypot access policy, threat monitoring policy and file activity tracking policy.

This section is dedicated to creating a new policy for "In-Depth Analysis", in the default groups all the necessary policies are active and selected.

## Enabling Policies

* **Configuration of Windows Object and Honeypot Access Policy**: This policy is designed for specific object access, CyberCyte uses honeypot for detection and these accesses can be managed by Windows object and honeypot access rules. The users can trust the processes with their signature or path. To edit Windows Object and Honeypot Access Rules, please go to Rules & Policies -> Artifact Collection Parameters -> Windows Object and Honeypot MonitorRules. That page allows users to edit/create/clone/enable/disable rules. Users can specify the rules that fit their requirements. With these rules, artifacts are specially analyzed for specific actions.

<figure><img src="/files/9ta5JXN5pd6VDjdNWPjl" alt=""><figcaption></figcaption></figure>

* **Configuration of Windows Threat Monitoring Policy**: This policy is designed for threat monitoring with customization options. The users can specify which rules are going to be used for this policy. Users can trust the processes with their signatures or paths. The portal provides live-action responses that can terminate processes, which can be enabled in this policy. For editing "Windows Threat Monitoring Rules", please go to "Rules & Policies" -> "Artifact Collection Parameters" -> "Windows Threat Monitoring Rules". That page allows users to edit/create/clone/enable/disable rules. Users can specify the rules that fit their requirements. With these rules, artifacts are specially analyzed for specific actions.

<figure><img src="/files/OdhOpSypUSJaNKBmQmQt" alt=""><figcaption></figcaption></figure>

* **Configuration of Windows  File Activity Tracking Policy**: This policy is designed for threat monitoring with customization options. The users can trust the processes with their signature or paths, this is needed for optimizing and enrichment of the data. Also, users can monitor all executable artifact activities, whitelisted artifact activities and terminate or delete unknown/risky/malicious files or processes.

<figure><img src="/files/YClkzVlbevEuKvix2Yzr" alt=""><figcaption></figcaption></figure>

## Assigning Policies To The Group

* Please go to Rules & Policies -> Policy Management -> Group Management. Click three dots on the right side of the group entry and select the "Edit" option. Select the policies to assign and click the "Save" button under the page.

<figure><img src="/files/sd1GtWQSU5lN75X7LmB0" alt=""><figcaption></figcaption></figure>

## Enabling Classification Rules for In-Depth Analysis

* Please go to "Rules & Policies" -> "Artifact Classifications" -> "Query-Based Classification". Search "Windows Object and Honeypot Access", "Threat Monitor" and "File Activity". Enable all the rules displayed on the grid. After enabling classification rules, the portal will analyze the data sets, and users can see the results under "Analysis & Investigation" -> "Artifact Analysis".

<figure><img src="/files/7JKcqSEXh0UHKJaiGEBu" alt="" width="284"><figcaption></figcaption></figure>


# Windows Hardening

1. When "Def. Windows Benchmarks CIS and DOD Analysis" or a policy with type "Windows Security Benchmark" policy is assigned to a group, the "Windows Hardening Analysis" will be performed, and the results will be collected. Please assign this policy to the group(s) by "Rules & Policies" -> "Policy Management" -> "Group Management".
2. Once the initial data is collected, go to "Security Assurance" -> "Hardening & Conf. Management" -> "Windows Hardening Results" by Name to view the hardening analysis results. The device-based view is also available by clicking Windows Hardening Results. On the top of the grid, the buttons "Remediate High-Risk Artifacts" and "Remediate Medium Risk Artifacts"  provide a template for applying the most command hardening configurations. When clicked, the results will be filtered.
3. A test group should be created to test the initial execution of the hardening configurations. The group members can be specified by setting their hostnames, IP ranges, or a custom property in the group settings. Please go to "Rules & Policies" -> "Policy Management "-> "Group Management" to access group management.
4. The results should be reviewed, and the hardening configurations not being applied can be excluded by creating a classification rule to set the risk score to 0 or a custom value like 25. The "Windows Benchmark Controls Exclude (Clone to Edit)" rule can be cloned, and the hardening configurations not to be applied can be added. Please go to "Rules & Policies" -> "Artifact Classification" -> "Query Based Classification" to access classification rules. When the match conditions are edited inside the rules, the "is one of" condition provides a filter where the artifacts can be selected based on their risk level.
5. Once the results to be excluded are added to the rule, the hardening controls to be applied can be chosen more easily.
6. Review the failed hardening controls from the "Windows Hardening Results by Name" grid and assign them to the newly created group using the remediation option on the top left of the grid. "Remediate High-Risk Artifacts" and "Remediate Medium Risk Artifacts"  provide a template for applying the most command hardening configurations. When clicked, the results will be filtered. After observing the remediation results on the test group, it can be extended to other devices.


# Remediation & Response Management

Remediation and Response management actions can be triggered through the artifact grids and classification rules. Remediation and Response actions are executed through functions. They can be reviewed, and new functions can be added by "Response Management" -> "Windows/Linux Remediation Functions". To create a new function, please press the "+Job" button. Custom functions can be created by using PowerShell commands and bat/bash scripts. For each remediation function, it is possible to define which grids the action will be available.

To monitor active jobs, please go to "Response Management" -> "Windows/Linux Remediation". Current jobs can be enabled, disabled, or removed through the "…" button. The remediation summary section is accessible to review the state of all active jobs by "Response Management" -> "Windows/Linux Remediation" -> "Windows/Linux Remediation Summary". Response actions can be triggered for an artifact on the grids by right-clicking on the artifact and selecting the "Remediate" option. The task can be created for a single device, a group, or all devices. A job can run continuously, remaining active as long as it is manually disabled. Devices can also run the job once or on every communication cycle to the server. Once the parameters are set, click the "OK" button to create a remediation/response job.

The job history can be seen by "Response Management" -> "Windows/Linux Remediation" -> "Windows/Linux Remediation Logs". To create an automated remediation/response job, edit a classification rule with "Notify on Match" or "Notify on Non-Existence." From the rule settings, add a notification by clicking the "+Notification" button. An existing remediation/response job can be selected, or a new one can be created by clicking the "+Notification Setting" button once the job type is selected. All parameters can be configured.

For SSH and Powershell based remediation functions, values of grids can be used. $#{\<column-name} is used for the values of columns within the grids. ##{\<variable-name} is used to request a value from the user on execution. &#x20;


# Notification Management

The CyberCyte Portal allow users to configure the initial settings in a minute. This section includes:

* Notification,
* Reporting,
* Agent deployment,
* Policy management

Also, these configurations can be done manually one by one. But for quick setup, we highly recommend this section. Please navigate to "Most Used" -> "Initial Settings & Deployment" to access.&#x20;

<figure><img src="/files/YpQA77AgSPwqOu3pemN2" alt=""><figcaption></figcaption></figure>

Notifications can be also set manually or users can use the wizard to configure it.

## Wizard for Notification Configuration

* The portal has a wizard that guides the users on how to configure important settings in the organization. For access to the wizard please click this icon on the top right side of the web page:

<figure><img src="/files/cCWcFsqLGMfDndysHLec" alt=""><figcaption></figcaption></figure>

* After clicking the wizard icon, the portal will redirect the users to the configuration steps. For notifications, please click the 3rd step and do the steps that are shown in the wizard.

<figure><img src="/files/8eJEXNJog4zsapwosn87" alt=""><figcaption></figcaption></figure>

<figure><img src="/files/SbnGI4BZl0ADlvdA1YVO" alt=""><figcaption></figcaption></figure>

<figure><img src="/files/FXmelFupalmFSwObqc0C" alt=""><figcaption></figcaption></figure>

<figure><img src="/files/L25wkIOHeNrFx8lh8cHv" alt=""><figcaption></figcaption></figure>

## Using Notable Events for Notifications&#x20;

To get notifications for notable events please go to the Rules & Policies -> Query Based Classifications. Please select the "Notable Events" on the artifact type sections search bar and make sure they are all enabled. If they are not enabled, click on the "..." button top left of the table.

After enabling the rules, please go to Settings & Reporting -> Notification Settings -> Notification Parameters. Create a new setting like below:

<figure><img src="/files/tKHjgiN8OIf6FOn8XM9w" alt=""><figcaption></figcaption></figure>

Go to "Settings & Reporting" -> "Notification Settings" -> "Notification Templates" and clone the existing templates by clicking the "..." button on the right side of the grid. The templates are categorized with tags, each tag refers to an analysis.

<figure><img src="/files/OyojLdTglUK7aodR11GQ" alt=""><figcaption></figcaption></figure>

<figure><img src="/files/29Ozzoc2QqS5Rpg3t1bu" alt=""><figcaption></figcaption></figure>

After finishing the editing, save the template and click on the "..." button again. Select "Assign to Notify Rule(s)". Select the rules and click the "Next" button at the top right. By default, we suggest "Threat Analytics: Windows Object and Honeypot Access Events", "Threat Analytics: Windows File Activity Analysis", "Threat Analytics: Windows Sysmon Threat Analysis", and "Windows: Windows Sysmon Analysis" rules, but users can add more or less. The demonstration is below:

<figure><img src="/files/JyPSMPv9v6PdGVAdTNUH" alt=""><figcaption></figcaption></figure>

Select the notification parameter that was just created and recheck the settings. If everything is okay, click on the "Assign" button. From now on, the portal will notify you if some notable event is captured.

<figure><img src="/files/Cat3TMaUvOK0uCx3LliS" alt=""><figcaption></figcaption></figure>

## Manuel Configuration for Notifications&#x20;

To assign and create notifications for Critical and High-Risk events. Please navigate to "Notification Settings Templates" from Settings & Reporting. Choose "Notable Event Notification Template" and click "..." to select "Assign to Notify Rules(s) action. Once selected apply the filter "All: Notable Event" and select the rules to send the notifications. Initially selecting the "Critical Risk Notable Events" and "Malicious Events" is recommended. Follow these steps to configure notifications manually:

1. By default, Twilio SendGrid is used to send the e-mails. A custom e-mail server can be configured from "Settings & Reporting" -> "Organization Settings" -> "Mail Server".

<figure><img src="/files/GoqbOYis7GnaiHRlgTss" alt=""><figcaption></figcaption></figure>

2. The second step is to configure the notification parameters. The parameters can be configured for each notification type. The notification parameters are configured through "Settings & Reporting" -> "Notification Settings" -> "Notification Parameters".

<figure><img src="/files/if0wnqjNCaBH9BZSp4s5" alt=""><figcaption></figcaption></figure>

* Once the notification parameters are configured, "Notification Setting Templates" define the notification messages. The templates are assigned to "Classification Rules" with the type "Notify". To customize a template, please click the "…" button, select the clone, and then edit the cloned template. Through the "…" button, the template is assigned to the classification rules where an alert is to be generated.

<figure><img src="/files/SAweu4hMFq5xNncTNgL8" alt=""><figcaption></figcaption></figure>

* Through classification rules, the notification messages can be customized further under the "Rules & Policies" -> "Artifact Classification" -> "Query Based Classification". Classification rules with the type **"Notify on Match"** is used to execute notifications.

<figure><img src="/files/g8R9V0nZcXFfD8AuWxKS" alt=""><figcaption></figcaption></figure>


# Vulnerability Management

The portal can integrate with OpenVAS & Tenable Nessus. The integration steps are the same. Please go to "Settings & Reporting" -> "Credential Settings" and click on the "+ Credential" button.

<figure><img src="/files/oMpRTme7caHn4IG1bxEb" alt=""><figcaption></figcaption></figure>

After creating the credential, please go to "Settings & Reporting" -> "Integration Settings" -> "Repository Management" and click on the "+ Repository" button.

<figure><img src="/files/4AAM1AkaAcK72T3chULe" alt=""><figcaption></figcaption></figure>

Fill in the repository type, destination (e.g. http(s)://destination.address:port), and the remote credential that was just created. If the portal can access the destination "Poll from Server" option can be used, otherwise please deploy the sensor server, disable the "Poll from Server" option, and select the sensor. After assigning credentials and repository please go to "Security Assurance -> Vulnerability Management -> Vulnerability Scan Results". On this page, users can analyze the results.

<figure><img src="/files/WGnY6uTLhIAi2imgjEzn" alt=""><figcaption></figcaption></figure>


# Network Discovery

The CyberCyte portal can discover users network assets with agents. The users select one of the machine for scan the network, users can create another policy for scanning the another network on their side.

Please navigate to "Rules & Policies" -> "Policy Rules". Click on the "+ Policy" button to create a new policy. There is a built-in policy, if new policy required users can use this step. Please select the module named "Scenario/Discovery/Integration" and type named "IP Scan & Penetration Testing".

<figure><img src="/files/fwnYZKJHRb0IbllRhK2x" alt=""><figcaption></figcaption></figure>

Please provide a policy name, assign the policy to the specified group(s) and set the policy enabled. The collection interval can be changed, the default value is 30 minutes. "Scanner Host" section is important, because the selected host machine will do the network discovery. After the host selection, IP blocks should provided. Port scan option is enabled by default but it can be disabled.

The uses can add additional SNMP community names with typing and pressing enter. By default the "Scenario Tests" activated but "Brute Password Tests" and "Vulnerability Scan" options can activated. If "Vulnerability Scan" is selected the scan interval should be selected and time intervals should be defined.

<figure><img src="/files/g0IXmpfKUCqPlVjwflNS" alt=""><figcaption></figcaption></figure>

<figure><img src="/files/MrdQmxgiQwaFbiuRgh8T" alt=""><figcaption></figcaption></figure>

Click to "Save" button to save the policy. When the specified host machine's agent communicate with the portal, it will get the policy and start scanning the network if the current time is matched with the policy; if it is not, the agent will scan the network between the specified intervals on the policy.

The results can be seen under the "Asset Management" -> "Endpoint Management". For an example, please take a look at the image below, the machines are discovered by agent with network discovery.

<figure><img src="/files/zahtmSUSZwctk0I5HZLN" alt=""><figcaption></figcaption></figure>


# Windows Patch Management

The CyberCyte portal provides a patch management module for Windows updates. The users can select patches and apply one by one.

Please follow these steps below for proper configuration:

* Login to the CyberCyte portal and navigate to "Rules & Policies" -> "Policy Management" -> Search for "Windows OS Patching Def. Policy" with search bar. Click on the three dots right side of the grid and click on the "Edit" button.
* By default, only the "Notify If Reboot Needed" should be enabled and default "Collection Interval" should be 4 hours.

<figure><img src="/files/yDU4eSJWvi0pyNKqGXr4" alt=""><figcaption></figcaption></figure>

The important parameters are explained in the table below:

| Parameter                                      | Description                                                                          |
| ---------------------------------------------- | ------------------------------------------------------------------------------------ |
| Assigned Groups                                | The groups that take the policy.                                                     |
| Collection Interval (Hours)                    | Th interval for data collection, default is 4 hours.                                 |
| Immediately Install Defender Signature Updates | Option for installing MS Defender signature updates. Disabled by default.            |
| Install Security OS Patches                    | Option for installing security OS patches. Enabled by default.                       |
| Install Security Patches with Secerity         | The section for classify the seveirity of the OS patches.                            |
| Install Critical OS Patches                    | The option for installing the critical OS patches. Disabled by default.              |
| Install OS Patches                             | The option for enabling the installation of the OS patches. Disabled by default.     |
| Delay Applying Non-Security Patches (Days)     | The day interval for delay applying the non-security patches. The default is 5 days. |
| Delay Applying Secuirty Patches (Days)         | Tha day interval for delay applying the security packages. The default is 1 day.     |
| Notify If Reboot Needed                        | The option for notify if reboot is needed.                                           |
| Notification Timeout (Hours)                   | The timeout for notification. The default is 12 hours.                               |
| Notification Message Header                    | The message header for notification.                                                 |
| Notification Message                           | The content of the notification message.                                             |
| Enable Reboot                                  | The option for enabling the reboot. Disabled by default.                             |
| Reboot Delay After Patches are Applied (Days)  | The day interval for after applying the patches. The default is 3 days.              |
| Security Patch Installation Frequency          | The frequency for security patch installation. The default is daily.                 |
| Patch Installation Frequency                   | The frequency for patch installation. The default is daily.                          |
| Patch Installation Weekday(s)                  | The multiselect section that designed for selecting the patch installation days.     |
| Patch Installation Time Interval               | The time interval for patch installation in day time.                                |
| Delete Download Patch Files Interval (Days)    | The interval for deletion of the downloaded patch files.                             |
| Patch Types to Install                         | The patch types for specific patch installation.                                     |

* Click on the "Save" button. The agent will take the policy in the next iteration. The results can be observed under the "Security Assurance" -> "Windows Patch Management" -> "Missing Patches".
* The users can trigger updates from the grid with right click -> "Patch Management" -> "Install Immediately" or "Plan Installation Date".

<figure><img src="/files/xo0gjpCPeQWxIgUAyKZo" alt=""><figcaption></figcaption></figure>

| Sections                  | Description                                                                                                                                                    |
| ------------------------- | -------------------------------------------------------------------------------------------------------------------------------------------------------------- |
| Patch Management          | This section display all of the machines patch information. The users can observe the machines last update information.                                        |
| Missing Patches           | The missing patches are listed in this section. The users can observe the missing patches and trigger the specific path update on the machine from the portal. |
| Missing Patches Analysis  | This section allows users to observe the missing pathes properties.                                                                                            |
| Patch Testing Jobs        | This section allow users to observer the patch testing jobs that assigned on devices.                                                                          |
| Patch Testing Job Results | This section allow users to observer the patch testing job results that assigned on devices with details.                                                      |
| Patch Histroy             | This section allow users to observe the patch update history on the machines. The users can uninstall the patches on the machines.                             |
| Excluded Patches          | This sections represents the excluded patches on the devices                                                                                                   |


# IP Scanning

The CyberCyte can scan the internal network and display the results on the portal. For IP scanning the portal requires a Linux machine, on the machine CyberCyte agent will scan the network and return results to portal.

Please follow these steps below:

* Please login to the CyberCyte Portal.
* Navigate to "Rules & Policies" -> "Policy Management" and search for "Def. IP Scan & Network Testing Policy". Click on the policy name or three dots right side of the entry and click on the "Edit" button.
* The default collection interval is 30 minutes. Users should fill these fields below:
  * Scanner Host: The scanner host must be a Linux machine with CyberCyte agent.
  * IP Block: For example 192.168.1.0/24, the field can take multiple IP blocks, users need to type the IP block and press enter for apply.
* The other sections are designed for scenario and vulnerability tests. Other fields are optional. If users want to execute vulnerability and scenario tests on the network, the "Execute Standard Scenario Tests" and the "Execute Vulnerability Scan" options should be enabled, also the "Run Vulnerability Scan Every X" should be selected as users requirements.

<figure><img src="/files/fwnYZKJHRb0IbllRhK2x" alt=""><figcaption></figcaption></figure>

| Parameters                                        | Description                                                                      |
| ------------------------------------------------- | -------------------------------------------------------------------------------- |
| Assigned Groups                                   | The groups for policy assignments.                                               |
| Collection Interval                               | The interval for executing the policy.                                           |
| Scanner Host                                      | The scanner host for scanning the IP block and execute scenario tests.           |
| IP Blocks                                         | The IP blocks for scanning.                                                      |
| Enable Port Scan                                  | The option for enabling the port scan. Enabled by default.                       |
| SNMP Community Strings                            | The community strings for SNMP, defaults are "public", "private" and "admin".    |
| Execute Standard Scenario Test                    | The option for executing the standard scenario tests.                            |
| Execute Brute Password Tests                      | The option for executing the brute password tests.                               |
| Execute Vulnerability Scan                        | The option for executing vulnerability scan.                                     |
| Run Vulnerability Scan Every X                    | The interval for executing the vulnerability scan.                               |
| Begin Vulnerability Scan After                    | The time field for beginning of the vulnerability scan.                          |
| Begin Vulnerability Scan Before                   | The time field for before the vulnerability scan.                                |
| Credentials                                       | The section for selecting the provided credentials.                              |
| Enable Tenable Nessus Scan                        | The option for enabling Tenable Nessus scan. Disabled by default.                |
| Tenable Nessus Address                            | The address of the Tenable Nessus                                                |
| Tenable Nessus Credential                         | The section for selecting the Tenable Nessus credential.                         |
| Tenable Nessus Use Existing Per Host Scan Policy  | The option for enabling Tenable Nessus "Use Existing Per Host Scan Policy".      |
| Tenable Nessus Existing Per Host Scan Policy Name | The section for selecting of the Tenable Nessus "Existing Per Host Scan Policy". |
| Tenable Nessus Use Existing Network Scan Policy   | The option for enabling Tenable Nessus "Use Existing Network Scan Policy".       |
| Tenable Nessus Existing Network Scan Policy Name  | The section for selecting of the Tenable Nessus "Existing Network Scan Policy".  |
| Tenable Nessus Perform Network Scan               | The option for enabling Tenable Nessus "Perform Network Scan".                   |
| Tenable Nessus Network Scan Ranges                | The section for selecting of the Tenable Nessus "Network Scan Ranges".           |
| Enable Acunetix Scan                              | The option for enabling Acunetix scan.                                           |
| Acunetix Address                                  | The section for providing Acunetix address.                                      |
| Acunetix Credential                               | The section for providing Acunetix credential                                    |
| Acunetix Target URLs                              | The sction for providing Acunetix target URLs.                                   |

* CyberCye platform can integrate with Tenable Nessus, if the credentaisl provided on the policy settings, the agent will connect to Tenable Nessus and execute vulnerability scans per host.
* After everything is configured, please click on the "Save" button. The result can be observed under the "Asset Management" and "Security Assurance" -> "Vulnerability Management" pages.


# Software Management

The CyberCyte portal provides built-in software management. The users can intall/upgrade/uninstall applications. Also, users can upload any package to CyberCyte portal with execution parameters, portal accepts .exe, .msi and .zip formats.

## How to Deploy a Package?

* Please navigate to "Security Assurance" -> "Software Management" -> click on the "+ Package".
* Please edit the package configuration with filing these parameters:

<table><thead><tr><th>Required Fields</th><th>Description</th><th data-hidden></th></tr></thead><tbody><tr><td>Name</td><td>The package name for displaying the package on the portal</td><td></td></tr><tr><td>Applicaiton Name</td><td>The actual applicaiton name for discoverin the app on the machine. The wildcard is supported.</td><td></td></tr><tr><td>Version</td><td>The actual application version for compare the exit app on the machine.</td><td></td></tr><tr><td>Process Name</td><td>The actuall applicaiton process name that can be observed on the task manager. The wildcard is supported.</td><td></td></tr><tr><td>File Name</td><td>The section for selecting and uploading the applicaiton.</td><td></td></tr><tr><td>Timeout</td><td>The timeout in seconds to execute install, upgrade or uninstall command.</td><td></td></tr><tr><td>Install Command Type</td><td>The option for installation command type, users can select command line arguments or powershell scripts.</td><td></td></tr><tr><td>Install Command</td><td>The installation commands/scripts.</td><td></td></tr><tr><td>Upgrade Command Type</td><td>The option for upgrade command type, users can select command line arguments or powershell scripts.</td><td></td></tr><tr><td>Upgrade Command</td><td>The upgrade commands/scripts.</td><td></td></tr><tr><td>Uninstall Command Type</td><td>The option for uninstall command type, users can select command line arguments or powershell scripts.</td><td></td></tr><tr><td>Uninstall Command</td><td>The uninstall commands/scripts.</td><td></td></tr></tbody></table>

<figure><img src="/files/Y3L1n5uwjtpYWtAuyKgW" alt=""><figcaption></figcaption></figure>

* Click on the "Save" button. The package will be start to upload, please wait for complation of the upload process. After the upload process is completed, the package is ready for deployment.

## How to Deploy a Package on a Device(s)?

* &#x20;Please navigate to "Security Assurance" -> "Windows Applicaiton Jobs" -> click on the "+ Package Job".
* Please edit the package job configuration with these parameters below:

| Required Fields          | Description                                                               |
| ------------------------ | ------------------------------------------------------------------------- |
| Name                     | The package job name                                                      |
| Package                  | The package that wanted to deploy on the device(s).                       |
| Assigned Host            | The host/device list. The users can select specific hosts for deployment. |
| Assigned Groups          | The group list. The users can select specific groups for deployment.      |
| Enable Installation      | The option for enabling the installation.                                 |
| Enable Upgrade           | The option for enabling the upgrade.                                      |
| Enable Uninstall         | The option for enabling the uninstallation.                               |
| Uninstall Before Upgrade | The option for enabling the uninstallation before upgrade process.        |
| Retry Interval (Hours)   | The interval for retrying the job execution.                              |
| Retry Attempts           | The attempt count for job execution.                                      |
| Run Once                 | The option for enabling the one or infinte job loop.                      |

<figure><img src="/files/alwhqR7nx41MYY2exk1D" alt=""><figcaption></figcaption></figure>

* Click on the "Save" button. The agent will get the package job and execute the job for next iteration.

## Where to See Package Jobs Logs?

* Please navigate to "Security Assurance" -> "Windows Package Management Logs".
* The logs are provided under this page. The users can observe the job results.

<figure><img src="/files/JdQjmY5xi3fcl0yhVF9c" alt=""><figcaption></figcaption></figure>


# Managing Shadow-IT

The users can manage  their shadow-IT infrastructure and they can white list with simple interactions.

* Please navigate to "Dashboards" -> "Shadow IT".
* Click on one of the filters listed top of the grid. They are highlighted with purple color.
* After selection one of the filter, please click on the "+" button on the entries for white listing.
* If the entry is required to be white listed, please click on the right-click and select "List Management" -> "Add to Global White List".
* For demonstration, please review the image below as an example:

<figure><img src="/files/qacp5RuiexiWGqSrBl3j" alt=""><figcaption></figcaption></figure>

<figure><img src="/files/vhshmNI7i5LesLaYR9CC" alt=""><figcaption></figcaption></figure>

<figure><img src="/files/Yp7sRDvJbajRqpOaTVD5" alt=""><figcaption></figcaption></figure>


# Microsoft Windows Defender Health Analysis

The CyberCyte portal can analyse Windows Defender health state. For activating this module, please follow these steps below:

* Please navigate to "Rules & Policies" -> "Policy Management" -> Click on the "Microsoft Defender Health Analysis Policy" policy.
* Users can configure the policy with paremeters as company requirements. Also, users can assign the policy with default parameters.

| Parameters                               | Descriptions                                                           |
| ---------------------------------------- | ---------------------------------------------------------------------- |
| Assigned Groups                          | The groups for assigning the policy.                                   |
| Collection Interval                      | The interval for data collection.                                      |
| Enable Signature Update                  | The option for enabling the signature update.                          |
| Perform Quick Scan                       | The optiion for enabling quick scan.                                   |
| Quick Scan Interval (Hours)              | The interval for quick scanning.                                       |
| Perform Full Scan                        | The option for enabling full scan.                                     |
| Full Scan Interval (Hours)               | The interval for full scanning.                                        |
| Enable All Modules If Not Running        | The option for enabling all the modules if they are not running.       |
| Enable Mandatory Modules If Not Running  | The option for enabling the mandatory modules if they are not running. |
| Custom Command                           | The field for defining a custom command.                               |
| Initialization Script                    | The field for defining a initialization script.                        |
| Execute MDE Client Analyzer              | The option for executing the MDE client analyzer.                      |
| MDE Client analyzer Run Interval (Hours) | The run interval for MDE client analyzer.                              |
| Maintenance Intervals                    | The time intervals for maintenance.                                    |

* After assigning the policy, please navigate to "Threat Hunting" -> "Analysis & Investigation" -> "Microsoft Defender Analysis". The users can see the results on the grid and analyze.


# Configuring Sysmon


# Sysmon Deployment

From "Settings & Reporting" -> "Deployment Settings" -> "Installation Management" menu, sysmon can be deployed. When "Enable Sysmon & Upgrade Sysmon" is selected from Microsoft Windows Agent, Sysmon is installed by the platform. Sysmon is not included in the agent. Agent Software Management feature downloads and installs Sysmon externally.


# Managing Sysmon Rules

Sysmon rules are managed through Sysmon Rules. The created rules are then used in policies. Sysmon policy creates the Sysmon configuration file dynamically based on the selected rules.

The rules are defined in "Rules & Policies" -> "Artifact Classification Parameters" -> "Windows Sysmon Rules". Each rule consists of the following parameters:

·        Events: Sysmon event IDs are included in the rules. The conditions are added to the event setting in the sysmon configuration based on the events selected.

·        Name: Name given to rule.

·        Description: Description given to rules.

·        Rule Tags: Policies use TAGS to select which rules will be active. TAGS enable easier selection of rule sets.

·        Filtering Level: Filtering levels guide users on the level of filtering the rule will execute. It can be low, medium or high.

·        Origin: Global rules are synchronized from the threat intelligence db. When a user creates a new rule, they are set as "User Defined."

·        Condition: Condition defines the Sysmon configuration to be applied. More information is available from <https://learn.microsoft.com/en-us/sysinternals/downloads/sysmon>.

·        Type: Sysmon configuration has two parts for every event id in the configuration file. The rule can be used for inclusion or exclusion. The purpose of the rule is defined here.

The rules can be edited directly from the Windows Sysmon Rules or the sysmon analysis grid. The sysmon analysis grid provides an easier way to add new items to the rules, as detailed below.

<figure><img src="/files/2iFZgiu85Lh5nGCqnJ1A" alt=""><figcaption></figcaption></figure>

From the sysmon analysis grid, when right-clicking a value, the values can be added to the sysmon rules by selecting the "Rule Management" -> "Add to Sysmon" action. The system will request which rule the user will add the value. The users can also choose which parameters will be used. Upon completion, the new value will be added to the end of the "Condition" section of the rule.

<figure><img src="/files/PCx2dXXschK1udWDoL6Y" alt=""><figcaption></figcaption></figure>

The sysmon analysis grid can also add value to the built-in rules. This method is easier. The selected rule is added to the built-in rules, enabling users to add exclusions more easily. There are five built-in rules:

* Sysmon Rules -> Add to Image Exclusions (Event ID 1,2,5,7,9,11,12,15,26 adds \<Image>)&#x20;
* Sysmon Rules -> Add to Process Access Exclusions (Event ID 10 adds \<SourceImage>)
* Sysmon Rules -> Add to Network Access Exclusion Rules (Event ID 3,22 adds \<Image>)
* Sysmon Rules -> Add to Process Creation Exclusions (Event ID 1 adds \<Image>. \<CommandLine>, \<ParentImage>, \<ParentCommandLine>)
* Sysmon Rules -> Add to IP Address Exclusions (Event ID 3 adds \<DestinationIp>)
* Sysmon Rules -> Add to Process DNS Query Exclusions (Event ID 22 adds \<QueryName> )&#x20;


# Troubleshooting Sysmon Rules

Testing the final sysmon configuration file is recommended. From the policy, the configuration file can be downloaded. Click on the download button right side of the "Config File Content".

<figure><img src="/files/uOLnEb3xfqBiymIrit5C" alt=""><figcaption></figcaption></figure>

After downloading the file, please copy the file to the "C:\Program Files\THApplications" folder. Then, run the sysmon update command with the downloaded file's name, the command should be like this: "C:\Program Files\THApplications\cyrthwinsys.exe -c \<file-name>". The result should not give any errors.

<figure><img src="/files/ht4GquqaHOZVFsR6ZtMO" alt=""><figcaption></figcaption></figure>


# Important Settings


# Organization Settings

1\. The system uses a built-in e-mail server for sending e-mails. Define your mail server for sending e-mails to your users. To specify your mail server information go to Mail Server Settings under "Settings & Reporting" -> "Organisation Settings".

<figure><img src="/files/mfGYD5M5yrBHKA3Ncc8n" alt=""><figcaption></figcaption></figure>

2\. To manage the portal's main dashboard, appearance, and language. Go to user settings on the top left corner and select "Site Settings" to customize GUI and dashboards.

![](/files/-MTzamMgFX0R8AABxyhh)

3\. The system sends an e-mail to users for training and phishing simulation purposes. Define recipients of your e-mails from Settings & Reporting --> Users & Group menu. By clicking the green "+" button, the user can access different user definition options.

![](/files/-MTzazjJNGpQMV5unEet)

4\. The system sends e-mails only to verified domains. The registered e-mail domain is automatically added to the organization's domain list. To define an additional domain, go to Settings & Reporting --> Organisation Domain and click the "+Domain" button. Send an e-mail to one of the recipients in the designated domain and verify your domain by clicking the mail link.

![](/files/-MTzZRcDYyWNnCMIxwJE)

![](/files/-MTz_6bXQMybwmb8ThoI)

5\. The content of built-in system e-mails can be editable to enable an organization to customize the solution completely. The built-in systems e-mails are customized through "Settings & Reporting" -> "Notification Settings" -> "System E-mail Editor".

![](/files/-MTz_BIfC6SycmIfdKWH)

6\. Define an additional user for accessing the portal to manage your organization. To define a user, go to the organizations' page from the user setting on the top left corner and select "Invite" to specify the user's roles and e-mail address.

![](/files/-MTzaRm9I3dEWFYAvvbl)

![](/files/-MTz_M1u6O6SnGRYu7Sc)


# Utilizing the Platform Effectively and Interpreting the Artifact Analysis Results

* Once the SIGMA & YARA results are available, using classification rules and lists for whitelisting the artifacts is recommended. Using hash values, signing company, image, and parent image path enables fast classification. Using wildcards for certain paths also simplifies the whitelisting process.&#x20;
* YARA results enable identifying the risky files that are passive inside the system but can create false positives. For every file, digital signature information is added. Using the signer information in the classification rules can minimize the number of false positives.
* After whitelisting, creating a notification template and enabling the "Notify on Match" rules in Sysmon is recommended. When an unknown process to threat intelligence performs a risky behavior, it will be identified.
* A generic notification template can be used to send a notification when a malicious artifact is identified. The malicious activity rule is sufficient to assign the template to the "All Artifact." Artifact-specific classification rules should be used to get a more detailed notification.
* Windows Security Controls are used to secure the Windows endpoints. Creating a classification rule to identify which security controls will be omitted is recommended. A template is provided. It can be cloned, and the controls can be selected. Once identified, creating a test group and applying the security controls to test devices and monitor for a week is recommended. After initial monitoring, controls can be applied to the endpoints first and then to the servers.
* Commonly used security software packages can be deployed by the platform. Creating an automated job for automated installation on endpoints where the security software is not deployed is possible.


# How To  Manage False Positives and Optimizing the System

The portal can detect false positives, at that moment users should exclude those entries. In every table users can set entries as trusted, can add values to the white or black lists and also can append values to the classification rules. With that records are evaluated correctly and the portal provides better visibility. Every table has a bulk operation option in the "..." section.

* For Autoruns, Processes and Inventory Assets:
  * Setting as Trusted (optional): Right-click on the entry -> Actions -> Set as trusted. This option sets the entry risk score to 0 and shows it as trusted. This option is recommended for single or unique entries.
  * Adding to a Classification Rule (recommended): Right-click on the entry -> Rule Management -> Add Value as a Classification Rule -> Set the priority of the classification rule -> Scroll down and click on the "Save & Force Run This Rule" button.  This option is recommended for the classification of the captured records, this option affects all data.
  * Adding to a List (recommended): Right-click on the entry -> List Management -> Add to a Global While List. This option does the same as the classification rule, but faster. The entries no longer showed up as a false positive after that because they are on the white list. Also, this action can be taken for malicious artifacts. Users can simply add values to a Global Malware/Black List.
* For Sysmon Analysis:

  * Setting as Trusted (optional): Right-click on the entry -> Actions -> Set as trusted. This option sets the entry risk score to 0 and shows it as trusted. This option is recommended for single or unique entries.
  * Adding to a Classification Rule (recommended): Right-click on the entry -> Rule Management -> Add Value as a Classification Rule -> Set the priority of the classification rule -> Scroll down and click on the "Save & Force Run This Rule" button.  This option is recommended for the classification of the captured records, this option affects all data.
  * Adding to a List (recommended): Right-click on the entry -> List Management -> Add to a Global While List. This option does the same as the classification rule, but faster. The entries no longer showed up as a false positive after that because they are on the white list. Also, this action can be taken for malicious artifacts. Users can simply add values to a Global Malware/Black List.
  * Adding Values to the Sysmon Exclusions (highly recommended): Right-click on the entry -> Sysmon Rules Mgmt. -> Add to Image & Network Exclusion (This exclusion type can be changed for artifact type). This option is highly recommended because with this we exclude the values, and this provides great optimized Sysmon data.


# Using AI Modules


# AI Manuel Enrichment

## Manual AI Enrichment of the Artifacts

The users can ask AI to diagnose if the artifact is malicious. On the grids, users can click on the robot icon to ask AI about artifacts. The images below demonstrate an AI artifact enrichment process. After clicking the robot icon, the modal will appear on the right side of the screen. The question is also predefined but users can ask other questions as well.

The demonstration is below:

<figure><img src="/files/owfd6ToJa133nKGtpDQQ" alt=""><figcaption></figcaption></figure>

<figure><img src="/files/IHt4FXVmRqZhUDne9k16" alt=""><figcaption></figcaption></figure>


# AI Auto Enrichment

The CyberCyte platform can enrich the data with AI support. This enrichment is also automated and the portal keeps enriching the artifacts.

On the portal, artifact information is also enriched with AI. The enriched data can also be observed on the grids. With this enrichment, unknown or unclassified artifacts are now enriched with AI classification.

To enable auto-classification, please go to "MSSP" organization -> "Organization Management" -> "Organization Management". Click three dots right side of the grid and click on the "Edit" button. On the modal, scroll to the bottom and select the "Enable AI" option. This action will enable the auto-classification of artifacts.

<figure><img src="/files/GbUaAJbDVspknYM7q2vw" alt=""><figcaption></figcaption></figure>

<figure><img src="/files/HlvfFhEp4ernd76xXqbY" alt=""><figcaption></figcaption></figure>


# Automating AI Enrichment

## Question Wizard

Question Wizard is designed for users frequently asking questions about portal management. Users can manage sysmon data, process traffic status, threat analysis results, and AI enrichments. To use the Question Wizard, please click on the robot button on the upper right of the page.

<figure><img src="/files/t9cdGCh2tsUj4hTfxWVy" alt=""><figcaption></figcaption></figure>

After clicking the robot button, the Question Wizard modal will appear on the screen. Users can select predefined questions.

<figure><img src="/files/oEFLLVfX1l2uNUkbr6zW" alt=""><figcaption></figcaption></figure>

After the selection,  users can add AI recommendations the artifacts or artifact collection rules. As an example, logs creating too much traffic ca be excluded in three steps:

1 - Click on the "Check All Recommended",

2 - Click on the "Add All Checked to Image & Network Access Exclusions",

3 - Click on the "Add All Checked to Exclusions (per Relevant Event ID)".

These actions will check all the recommended artifacts and add them to the specific exclusion fields for sysmon. With those actions, the unnecessary sysmon artifacts are excluded from the collection and analysis.

<figure><img src="/files/aRJtIDPF0YDHDmomaWUl" alt=""><figcaption></figcaption></figure>

The sysmon exclusion lists can be observed from "Rules & Policies" -> "Artifact Collection Parameters" -> "Windows Sysmon Rules".

<figure><img src="/files/mlGoOMdc9KOUclkviy9Q" alt=""><figcaption></figcaption></figure>


# AI Auto Exclusions

The portal provides wide configuration options on AI auto-enrichment and auto-exclusions. The "AI Analysis Auto Exclusion Settings" should be saved before it starts to work. For that, users set the settings parameters.

<figure><img src="/files/Cz9MLZXZ38JTtDzPmbqR" alt=""><figcaption></figcaption></figure>

<figure><img src="/files/bdT7vdLlIAzQsXohaEd2" alt=""><figcaption></figcaption></figure>

<figure><img src="/files/HrkbM1ditNvfyVbIBWl8" alt=""><figcaption></figcaption></figure>

| Parameter                                                                              | Description                                                                                                |
| -------------------------------------------------------------------------------------- | ---------------------------------------------------------------------------------------------------------- |
| Classify, Enrich & Auto-whitelist for Windows processes                                | Enabling/Disabling the auto-classify, auto-enrichment, and auto-whitelisting for Windows processes.        |
| Classify, Enrich & Auto-exclude on Sysmon for Windows processes                        | Enabling/Disabling the auto-classify, auto-enrichment, and auto-whitelisting for Sysmon Windows processes. |
| Minimum Count Threshold for Auto AI Analysis Exclusions                                | The threshold setting for auto-analyze the artifacts.                                                      |
| Minimum Elastic Count Threshold for Auto AI Analysis Exclusions (optional, 0=disabled) | The elastic treshold for auto-exclusion.                                                                   |
| Auto AI Analysis Exclusions Run Interval                                               | The auto-exclusion run interval.                                                                           |
| Auto AI Analysis Exclusions Last Execution                                             | The auto-exclusion last execution time and date.                                                           |

***

The "AI Questions for Auto Exclusions" section is designed for auto-exclusion actions. Users can edit and disable/enable the automation options.

If exclusions are not optimized well, the portal will eventually get slower because of the junk data collection. That's why we always suggest optimizing sysmon exclusions.

<figure><img src="/files/zJTzRaPMp5950f622ME0" alt=""><figcaption></figcaption></figure>

The "Can you identify the Windows Sysmon processes creating excessive traffic in the last day and show them to me to add to the Sysmon Exclusion Rules?" question is recommended for auto exclusion. If this is enabled, sysmon artifacts that were captured on the last day which created excessive traffic will be analyzed by AI and excluded.


# AI Feedback Questions

The CyberCyte Portal provides AI feedbacks for analyzed artifacts. For that feedbacks, users must enable the feedback questions. Please navigate to "Settings & Reporting" -> "AI Settings" -> "AI Feedback Questions". Scroll down to "AI Feedback Questions Automation" section and enable the questions and automations for all displayed entries.

<figure><img src="/files/8hZ4ixCxK7g7PItMZbNx" alt=""><figcaption></figcaption></figure>

The results can be observed on any analysis. Please review the image below for an example, it shows the available feedback questions.

<figure><img src="/files/vVtutaikDrHXrN2Za037" alt=""><figcaption></figcaption></figure>

At the same time we can click on the "Show AI-Results" button to observe AI results. Click on this button that demonstrated below:

<figure><img src="/files/7poFBAnrzZxw6TYfqaW1" alt=""><figcaption></figcaption></figure>

The AI feedback results can be observed on the grid from now on like this:

<figure><img src="/files/JHJvKw6cjdyvdYDlZFGn" alt=""><figcaption></figcaption></figure>


# AI Auto Exclusion & Enrichment for Sysmon

AI Analysis Auto Exclusion Settings

The portal provides wide configuration options on AI auto-enrichment and auto-exclusions. The "AI Analysis Auto Exclusion Settings" should be saved before it starts to work. For that, users set the settings parameters.

<figure><img src="/files/lLCJwyJKfLojZ3TSGhy7" alt=""><figcaption></figcaption></figure>

| Parameter                                                                              | Description                                                                                                |
| -------------------------------------------------------------------------------------- | ---------------------------------------------------------------------------------------------------------- |
| Classify, Enrich & Auto-whitelist for Windows processes                                | Enabling/Disabling the auto-classify, auto-enrichment, and auto-whitelisting for Windows processes.        |
| Classify, Enrich & Auto-exclude on Sysmon for Windows processes                        | Enabling/Disabling the auto-classify, auto-enrichment, and auto-whitelisting for Sysmon Windows processes. |
| Minimum Count Threshold for Auto AI Analysis Exclusions                                | The treshold setting for auto-analyze the artifacts.                                                       |
| Minimum Elastic Count Threshold for Auto AI Analysis Exclusions (optional, 0=disabled) | The elastic treshold for auto-exclusion.                                                                   |
| Auto AI Analysis Exclusions Run Interval                                               | The auto-exclusion run interval.                                                                           |
| Auto AI Analysis Exclusions Last Execution                                             | The auto-exclusion last execution time and date.                                                           |

***

On every global interval matching along each enabled question's interval, any entry recommended to be excluded over the minimum threshold will be added to relevant exclusions by the Task automatically. The question checks Threat Intelligence Enrichments and AI Classifications to decide recommendations and excludes any value matching on 'Excluded Values from Auto Exclusions'.

The "AI Questions for Auto Exclusions" section is designed for auto-exclusion actions. Users can edit and disable/enable the automation options. We recommend allowing the "Can you identify the Windows parent processes creating excessive traffic in the last day and show them to me to add to the Lists?" question. This recommended option allows the portal to exclude parent processes that create excessive traffic on the last day. This is specifically designed for automating sysmon exclusions.

Questions having the same text combine different artifact types in a single analysis, so if you edit any configuration or interval for each of these, you'll need to edit in the same way for the others, and also make the question reflect the configuration accordingly (such as time range). Failure to edit all common with common values for configurations will break how they execute, which one will get prioritized is not pre-determined!

When you edit a Question, then you'll lose the ability to get the updates coming in newer versions for that question if they were to exist. You might then use the 'Remove & Reset' functionality to remove the question & it'll appear back with the updated state in a while. This, of course, means you'll lose your changes of it.

If exclusions are not optimized well, the portal will eventually get slower because of the junk data collection. That's why we always suggest optimizing sysmon exclusions.

<figure><img src="/files/Cz9MLZXZ38JTtDzPmbqR" alt=""><figcaption></figcaption></figure>

<figure><img src="/files/bdT7vdLlIAzQsXohaEd2" alt=""><figcaption></figcaption></figure>

<figure><img src="/files/HrkbM1ditNvfyVbIBWl8" alt=""><figcaption></figcaption></figure>

***

## Excluded Values from Auto Exclusions

The users can define values for auto exclusions. Values will be excluded from auto-exclusion by AI question executions. Also, values will be compared case-insensitively. Use \* as a wildcard and ? for single character matching.

<figure><img src="/files/yeXDRJERrhwAJryiEDey" alt=""><figcaption></figcaption></figure>


# AI Activity Logs

The portal also keeps the AI activity logs. Users can review the activities that AI made under the "Response Management" -> "AI Activity" -> "AI Audit Logs". The users can identify which action is taken with detailed information. Also, users can check if AI takes action or not.

<figure><img src="/files/LD10GiWyaGE4w5L1yfBG" alt=""><figcaption></figcaption></figure>

<figure><img src="/files/6h7wo0JHgdyysjBbLSsF" alt=""><figcaption></figcaption></figure>


# AI Chat

The AI chatbot allow users to gather information about their latest states, also users can re-search and analyse artifacts.

<figure><img src="/files/wJ8JT5GGQ3PdhVvPEtu5" alt=""><figcaption></figcaption></figure>


# GRC Management


# Creating an Assessment & Updating Evidences

The CyberCyte provides a GRC management module for checking the security standards.

Activating the GRC module is simple. Please navigate to "GRC" -> "Initial Activation" -> "Manage Audits". Create a new assessment, it can be based on NIST, ISO, CIS, or custom (the custom action is explained in the administration guide).

<figure><img src="/files/nurzyhtWWkOD2dtWWXEF" alt=""><figcaption></figcaption></figure>

Users can see the results on the "GRC" -> "GRC Dashboard" -> "GRC GAP Assessment".

<figure><img src="/files/INZPwZuXiIkLXblHgVSl" alt=""><figcaption></figcaption></figure>


# Control Management

## Managing Control Activities

* Navigate to **GRC / Control Management / Control Activity** and select the audit name to view the related control items.
* Click on a control item to start entering evidence and actions. Actions include:
  * Double-click **Answer** to provide responses.
  * Assign users via the pencil icon and select from system-defined users or groups.
  * Select **Compliance State** (Compliant / Not Compliant).
  * Set **Control Applicable** (Yes / No) and fill **Applicability Reason**.
  * Enter detailed notes in **Answer** and click OK. Previous answers are automatically populated for updates.

## Basic Parameters

* Previously entered answers can be viewed, updated, or added.
* **Control Implemented** can be set (Yes / No).
* Corrective or Preventive actions can be selected or created via **Create** link.
* Action plans can also be created via **GRC / Evidence & Parameter Management / Create**.

## Control Mappings

* Map control items to related standards, risks, evidences, documents, document templates, ToDo tasks, discovered assets, and non-IT assets.
* AI assistance is available via the robot icon for automatic mapping of documents and templates.
* Use the three-dot menu **Discover Related Mappings** to automatically map controls across standards.

## Activities and Notes

* Add activities via **Add Activity**.
* Notes for each control can be added, updated, or edited.

## Save & Notify

* Click **Save** to store updates.
* Click **Save and Notify Owner(s)** to update the owner with an email notification.
* Use **Update Related Controls** or **Update Based on Risk** from the three-dot menu for automatic updates.

## GRC Role Management

* Roles determine which users can see which menus and take which actions.
* Roles are managed under **MSSP / Tenant Management / Role Management**.


# Risk and Opportunity Management

## Risk Registry

* Navigate to **GRC / Risk and Opportunity Management** and open the **Risk Registry**.
* Initially, system-assigned risk registry items for related control items are displayed.
* Click the **Title** of a risk to edit details.
* **Basic Parameters** for a risk include:

  * **Title**: Non-editable.
  * **Category**: Risk or Opportunity.
  * **Status**: Open / Planned / In Progress / Rejected / Accepted / Completed / Completed & Verified.
  * **Description**: Risk description.
  * **Risk Type**: Internal, Third-Party, Compliance, Reputational, Technology, Operational, Strategic, Financial.
  * **Risk Owner Users / Groups**: Assign responsible users or groups.
  * **Other Assets**: Select Non-IT assets or create new ones via **GRC / Asset & Document Management**.
  * **Max Impact Assets**, **Risk Level**, **Likelihood**, **Impact**, **Confidentiality**, **Integrity**, **Availability**, **Residual Risk Level**, **Residual Risk Likelihood**, **Residual Risk Impact**, **Risk Treatment Option**, **Risk Treatment Type**, **Risk Treatment Description**, **Risk Controls**.

  **Note:** If predefined parameters are insufficient, they can be extended in **Evidence & Parameter Management**.

<figure><img src="/files/72ETu1KOD22aHXfQNr56" alt=""><figcaption></figcaption></figure>

## Advanced Parameters

* Process and Services can be selected or newly created.
* Rejection Reason, Discovered Assets, Max Importance Assets, and Detected Risk Score can be managed.
* Financial Impact / Cost, Expected / Actual Completion Dates, Review Dates, Risk Treatment State, and assignments to users and groups can also be configured.

<figure><img src="/files/fRHys4AG3rXPOmMj27Kr" alt=""><figcaption></figcaption></figure>

## Control Mappings

* Map risks to standards, incidents, classification rules, notable events, ToDos, evidences, documents, document templates, and control activities.

<figure><img src="/files/vvQcgKNR7K9sSELaIKpx" alt=""><figcaption></figcaption></figure>

## Activities

* Add activities via **Add Activity**.

## Risk Management Templates

* System-assigned risk items not linked to control items are displayed here.
* Use the three-dot menu → **Create Risk Registry Item** to create a new risk registry item.

<figure><img src="/files/i7u26dNKRaWspPZbPd62" alt=""><figcaption></figcaption></figure>

## Process Management

* View or edit existing processes.
* Create new processes with Name, Description, Status (Active / Inactive), Owner Users, and Owner Groups.

## Services Management

* View or edit existing services.
* Create new services with Name, Description, Owner Users, Owner Groups, Process, Value / Currency, and Related Assets.


# Asset & Document Management

## Documents

* View and edit previously recorded documents (policies, procedures).
* Create new documents with Name, Description, Document file, Confidentiality Level, Category, Type, Owner Users / Groups, Distribution Users / Groups, Next Review Date, Controls, Control Activities, Risks, and Risk Templates.
* **Save** or **Save and Notify Owner(s)/Distribution Users/Groups** for notifications.
* Combobox fields can be extended via the arrow if needed.

## Document Templates

* Download standard templates (e.g., ISO 27001) or customize organization-specific templates.
* Update Name, Description, Document, Confidentiality Level, Category, and other fields.

## Document Receipt Activity

* Monitor which users received document assignments and their activity.

## Assets

* Create or edit assets with Name, Description, Asset Class, Asset Status, Owner Users, Owner Groups, Asset Groups, Confidentiality Level, Impact, Integrity, and Availability.
* If combobox options are insufficient, new options can be created via the adjacent arrow.

## Asset Groups

* View or edit existing asset groups.
* Create new asset groups via **Create**.


# ToDo, Projects & Meetings

## ToDo

* Create tasks via **Add a Task** with Name, Due Date, Assigned User, etc.

<figure><img src="/files/s78n3TSTEp8E9N3QukjJ" alt=""><figcaption></figcaption></figure>

## Projects

* Create projects via **Create** with Name, Start Date, Expected Completion Date, Project Managers, Project State, etc.

## Project Tasks

* Create or edit project tasks via **Create**, entering Project Name, Task State, Task Name, and other parameters, linking them to existing projects.
* Tasks can be assigned to relevant users.

## Meetings

* Schedule meetings with Title, Meeting Date, Attendees, Related Controls, and link ToDo actions.


# Evidence & Parameter Management

* View evidences collected from system artifacts.
* Update combobox/dropdown values.
* **Note:** If predefined parameters are insufficient, new parameters can be created via the **Create** button. For example, add a new general parameter under Asset Class by entering "General" in Name and saving. This automatically updates the Asset Class dropdowns across GRC.

<figure><img src="/files/tWeXKHDKjVWxB4TdgNxp" alt="" width="119"><figcaption></figcaption></figure>


# GRC Settings

* Update or create Risk Management formulas, Assessment Standards, Controls linked to risk assessment standards, and NIST Core identifiers.

<figure><img src="/files/MTIRYL7ZsNbCxVj3IHBJ" alt=""><figcaption></figcaption></figure>


# TPRM

## Vendor Dashboard

* View vendors, risk overview, questionnaires, and assignment status.

<figure><img src="/files/lBqr14kEyKTj8oX2vloR" alt=""><figcaption></figcaption></figure>

## Vendors

* Add vendor information including Name, Group, Approval Status, Language.

<figure><img src="/files/YnZVIr7CRB8ZyJHDNpf3" alt=""><figcaption></figcaption></figure>

## Vendor Domain & Contacts

* Add responsible contacts with Email, Role, and other details for questionnaire completion.

<figure><img src="/files/UmFa2otCDsxRqUcr4Aqy" alt=""><figcaption></figcaption></figure>

<figure><img src="/files/Mak9SEopzMFen1tdrmSR" alt=""><figcaption></figcaption></figure>

## Questionnaires

* Assign custom questionnaires to vendors.

<figure><img src="/files/7Dw5Q8Ab3UwMuWBhXXPQ" alt=""><figcaption></figcaption></figure>

## Questionnaires Templates

* Select embedded questionnaire templates to assign.

<figure><img src="/files/jLJKrRzIVkgB4OkD9qQj" alt=""><figcaption></figcaption></figure>

## Question Templates

* Enable, disable, or delete system-defined templates.

<figure><img src="/files/jqEaxtadwLuEsk1Le2Om" alt=""><figcaption></figcaption></figure>

## Question Responses

* View responses and evidence, approve or reject.

<figure><img src="/files/3SxmhjGwcGGZw29A815b" alt=""><figcaption></figcaption></figure>


# Integrations


# Office 365 Azure Registration

The CyberCyte portal provide Office 365 integration for more comprehensive visibility. We recommend it for machines without an agent on the domain, accounts with unchanged passwords, locked accounts and analysis of the domain infrastructure.

## 1. Create MS Azure App

Please log in to the MS Azure Portal and navigate to <https://portal.azure.com/#view/Microsoft_AAD_RegisteredApps/ApplicationsListBlade>

Register a new applicaiton on a signle tennant with "+ New registration" button. Do not put any URL for endpoint.

<figure><img src="/files/uMNJDRA87vSJJ7UHY0ID" alt=""><figcaption></figcaption></figure>

<figure><img src="/files/LEkOkeUUMYvlmwmD6LZ5" alt=""><figcaption></figcaption></figure>

## 2. Get The Client ID & Tenant ID

After the registration, please navigate to "Manage" -> "Certificates & Secrets". Please add a new client secret and copy it.

<figure><img src="/files/WoCKQqXWh3nXAwwqxk9s" alt=""><figcaption></figcaption></figure>

From the "Overview" menu, please copy the "Application (client) ID" and "Directory (tenant) ID".

Go back to the "Manage" menu and navigate to "API permissions". Add a new permission and select the "Microsoft Graph Permission".

&#x20;

<figure><img src="/files/Z31md20MYXCBA1cDdnMD" alt=""><figcaption></figcaption></figure>

Select the "Applicaiton Permissions".

<figure><img src="/files/tjLLW8ohrvXxMbK622Wp" alt=""><figcaption></figcaption></figure>

Select the "Group.Read.All", "User.Read.All" and "GroupMember.Read.All", "Device.Read.All" permissions.

<figure><img src="/files/f1XvrBNgXcF5hJjcVB25" alt=""><figcaption></figcaption></figure>

Grand admin consent after adding the permissions.

<figure><img src="/files/Msln6PNE4ixOkxGm60hE" alt=""><figcaption></figcaption></figure>

## 3. Adding the MS Graph API Credential to The CyberCyte Portal

Please navigate to "Settings & Reporting" -> "Credential Settings" -> "Remote Credentials" -> Click on "+ Credential" button. Select the "Microsft Graph API Credential". copy the "Application (client) ID", "Directory (tenant) ID" and "Client Secret" that created on Azure Portal.

## 4. Repository Integration

Please navigate to "Settings & Reporting" -> "Integration Settings" -> "Repository Management". Click on the "+Repository" button to create a new Azure AD(Active Directory) repository and select the "Azure AD" as Type, and please select the credential that we created in the first step as a "Remote Credential". After that please fill the rest of the blank fields.

## 5. Reviewing the Results

Please navigate to "Dashboards" -> "Asset & Identity" -> "Asset Overview" -> "Domain Overview" and "Asset Overview". The "Domain Overview" and "Asset Overview" dashboards provides a great visibility on the active directory and domain information.

Also, the results can be analyzed from under the "Threat Hunting" -> "Analysis & Investigation" -> "Assets".

After integration, the data obtained must be validated and, if necessary, white-listing or rule definitions must be made. There are already defined rules on CyberCyte, and listing can be done with additional analyses to these rules. Our primary recommendation is to double-check in parallel with the existing solutions in the user's infrastructure.

You can access the relevant findings via dashboards, and you can go to the relevant analysis table by clicking on the data.

<figure><img src="/files/H9KQeZOysvlA979rghYS" alt=""><figcaption></figcaption></figure>

When you right-click on any data, you can provide list management under "List Management" from the options that appear on the screen. Similarly, if a special rule needs to be defined, you can create a special rule with the "Rule Management" -> "Add value as a Classification Rule" option and trigger the notification mechanism. The rule management explained in this link <https://docs.cloudcyte.com/getting-started/classification-rules>.


# Windows Security Center Azure Registration

The CyberCyte portal provide Windows Security Center integration for more comprehensive visibility. We recommend it for observe all the security events from users infrastructure from one portal.

## 1. Create MS Azure App

Please log in to the MS Azure Portal and navigate to <https://portal.azure.com/#view/Microsoft_AAD_RegisteredApps/ApplicationsListBlade>

Register a new applicaiton on a signle tennant with "+ New registration" button. Do not put any URL for endpoint.

<figure><img src="/files/uMNJDRA87vSJJ7UHY0ID" alt=""><figcaption></figcaption></figure>

<figure><img src="/files/LEkOkeUUMYvlmwmD6LZ5" alt=""><figcaption></figcaption></figure>

## 2. Get The Client ID & Tenant ID

After the registration, please navigate to "Manage" -> "Certificates & Secrets". Please add a new client secret and copy it.

<figure><img src="/files/WoCKQqXWh3nXAwwqxk9s" alt=""><figcaption></figcaption></figure>

From the "Overview" menu, please copy the "Application (client) ID" and "Directory (tenant) ID".

Go back to the "Manage" menu and navigate to "API permissions". Add a new permission and select the "Microsoft Graph Permission".

&#x20;

<figure><img src="/files/Z31md20MYXCBA1cDdnMD" alt=""><figcaption></figcaption></figure>

Select the "Applicaiton Permissions".

<figure><img src="/files/tjLLW8ohrvXxMbK622Wp" alt=""><figcaption></figcaption></figure>

Select the "SecurityIncident.ReadWrite.All", "SecurityEvents.ReadWrite.All" and "User.Read.All" permissions.

<figure><img src="/files/f1XvrBNgXcF5hJjcVB25" alt=""><figcaption></figcaption></figure>

Grand admin consent after adding the permissions.

<figure><img src="/files/Msln6PNE4ixOkxGm60hE" alt=""><figcaption></figcaption></figure>

## 3. Adding the MS Graph API Credential to The CyberCyte Portal

Please navigate to "Settings & Reporting" -> "Credential Settings" -> "Remote Credentials" -> Click on "+ Credential" button. Select the "Microsft Graph API Credential". copy the "Application (client) ID", "Directory (tenant) ID" and "Client Secret" that created on Azure Portal.

## 4. Repository Integration

Please navigate to "Settings & Reporting" -> "Integration Settings" -> Click on "+ Integration " button. Select the "Microsoft Defender Security Center" as a type, select a credential and enable the repository. The recommended sync interval is 15 minutes.

## 5. Reviewing the Results

Please navigate to "Analysis & Investigation" -> "Artifact Analysis" -> "Threat Management" -> "Microsoft Defender Security Center Events" to observe Windows security center events.

After integration, the data obtained must be validated and, if necessary, white-listing or rule definitions must be made. There are already defined rules on CyberCyte, and listing can be done with additional analyses to these rules. Our primary recommendation is to double-check in parallel with the existing solutions in the user's infrastructure.

You can access the relevant findings via dashboards, and you can go to the relevant analysis table by clicking on the data.

<figure><img src="/files/H9KQeZOysvlA979rghYS" alt=""><figcaption></figcaption></figure>

When you right-click on any data, you can provide list management under "List Management" from the options that appear on the screen. Similarly, if a special rule needs to be defined, you can create a special rule with the "Rule Management" -> "Add value as a Classification Rule" option and trigger the notification mechanism. The rule management explained in this link <https://docs.cloudcyte.com/getting-started/classification-rules>.


# Azure Active Directory Integration

The CyberCyte portal provide Azure Active Directory integration for more comprehensive visibility. We recommend it for machines without an agent on the domain, accounts with unchanged passwords, locked accounts and analysis of the domain infrastructure.

## 1. Create MS Azure App

Please log in to the MS Azure Portal and navigate to <https://portal.azure.com/#view/Microsoft_AAD_RegisteredApps/ApplicationsListBlade>

Register a new applicaiton on a signle tennant with "+ New registration" button. Do not put any URL for endpoint.

<figure><img src="/files/uMNJDRA87vSJJ7UHY0ID" alt=""><figcaption></figcaption></figure>

<figure><img src="/files/LEkOkeUUMYvlmwmD6LZ5" alt=""><figcaption></figcaption></figure>

## 2. Get The Client ID & Tenant ID

After the registration, please navigate to "Manage" -> "Certificates & Secrets". Please add a new client secret and copy it.

<figure><img src="/files/WoCKQqXWh3nXAwwqxk9s" alt=""><figcaption></figcaption></figure>

From the "Overview" menu, please copy the "Application (client) ID" and "Directory (tenant) ID".

Go back to the "Manage" menu and navigate to "API permissions". Add a new permission and select the "Microsoft Graph Permission".

<figure><img src="/files/Z31md20MYXCBA1cDdnMD" alt=""><figcaption></figcaption></figure>

Select the "Applicaiton Permissions".

<figure><img src="/files/tjLLW8ohrvXxMbK622Wp" alt=""><figcaption></figcaption></figure>

Select the permissions in the list provided below:

<table data-header-hidden><thead><tr><th valign="top"></th><th valign="top"></th><th valign="top"></th></tr></thead><tbody><tr><td valign="top">AdministrativeUnit.Read.All</td><td valign="top">Application</td><td valign="top">Read all administrative units</td></tr><tr><td valign="top">Contacts.Read</td><td valign="top">Delegated</td><td valign="top">Read user contacts</td></tr><tr><td valign="top">Contacts.Read</td><td valign="top">Application</td><td valign="top">Read contacts in all mailboxes</td></tr><tr><td valign="top">Contacts.Read.Shared</td><td valign="top">Delegated</td><td valign="top">Read user and shared contacts</td></tr><tr><td valign="top">Directory.Read.All</td><td valign="top">Delegated</td><td valign="top">Read directory data</td></tr><tr><td valign="top">Directory.Read.All</td><td valign="top">Application</td><td valign="top">Read directory data</td></tr><tr><td valign="top">email</td><td valign="top">Delegated</td><td valign="top">View users' email address</td></tr><tr><td valign="top">Group.Read.All</td><td valign="top">Delegated</td><td valign="top">Read all groups</td></tr><tr><td valign="top">Group.Read.All</td><td valign="top">Application</td><td valign="top">Read all groups</td></tr><tr><td valign="top">GroupMember.Read.All</td><td valign="top">Delegated</td><td valign="top">Read group memberships</td></tr><tr><td valign="top">GroupMember.Read.All</td><td valign="top">Application</td><td valign="top">Read all group memberships</td></tr><tr><td valign="top">User.Read</td><td valign="top">Delegated</td><td valign="top">Sign in and read user profile</td></tr><tr><td valign="top">User.Read.All</td><td valign="top">Delegated</td><td valign="top">Read all users' full profiles</td></tr><tr><td valign="top">User.Read.All</td><td valign="top">Application</td><td valign="top">Read all users' full profiles</td></tr><tr><td valign="top">User.ReadBasic.All</td><td valign="top">Delegated</td><td valign="top">Read all users' basic profiles</td></tr><tr><td valign="top">Office 365 Exchange </td><td valign="top"></td><td valign="top"></td></tr><tr><td valign="top">Contacts.Read</td><td valign="top">Delegated</td><td valign="top">Read user contacts</td></tr><tr><td valign="top">Contacts.Read.All</td><td valign="top">Delegated</td><td valign="top">Read user and shared contacts</td></tr><tr><td valign="top">Contacts.Read.Shared</td><td valign="top">Delegated</td><td valign="top">Read user and shared contacts</td></tr><tr><td valign="top">Group.Read.All</td><td valign="top">Delegated</td><td valign="top">Read all groups (preview)</td></tr><tr><td valign="top">People.Read</td><td valign="top">Delegated</td><td valign="top">Read users' relevant people lists (preview)</td></tr><tr><td valign="top">User.Read</td><td valign="top">Delegated</td><td valign="top">Read user profiles</td></tr><tr><td valign="top">User.Read.All</td><td valign="top">Delegated</td><td valign="top">Read all users' full profiles</td></tr><tr><td valign="top">User.ReadBasic.All</td><td valign="top">Delegated</td><td valign="top">Read all users' basic profiles</td></tr><tr><td valign="top">User.ReadBasic.All</td><td valign="top">Delegated</td><td valign="top">Read all users' basic profiles</td></tr></tbody></table>

Grand admin consent after adding the permissions.

<figure><img src="/files/Msln6PNE4ixOkxGm60hE" alt=""><figcaption></figcaption></figure>

## 3. Create Remote Credential in Portal

Please navigate to "Settings & Reporting" -> "Integration Settings" -> "Credential Settings". Click on the "+ Credential" button to create a new credential. Select the "Microsoft Graph API Credential" as a "Credential Type".

## 4. Create a Repository on the Portal

Please navigate to "Settings & Reporting" -> "Integration Settings" -> "Repository Management". Click on the "+Repository" button to create a new Azure AD(Active Directory) repository and select the "Azure AD" as Type, and please select the credential that we created in the first step as a "Remote Credential". After that please fill the rest of the blank fields.

## 5. Create a Policy in the Portal

Please navigate to "Rules & Policies" -> "Policy Management" -> Click on the "+ Policy" button. Please select the module named "Scenario and Network Discovery" and type named "Active Directory Analysis". After the selection, required fields will appeared. Please fill in the blanks with required values. For default values, users can use these values in images below.

The users can assign this policy to their group(s). Also, the collection intervals can be changed to their requirements.

The users can add custom tags by just typing and hitting the enter. The policy will automatically accept the tags.

## 6. Reviewing the Results

Please navigate to "Dashboards" -> "Asset & Identity" -> "Domain Overview" and "Asset Overview". The "Domain Overview" and "Asset Overview" dashboards provides a great visibility on the active directory and domain information.

After integration, the data obtained must be validated and, if necessary, white-listing or rule definitions must be made. There are already defined rules on CyberCyte, and listing can be done with additional analyses to these rules. Our primary recommendation is to double-check in parallel with the existing solutions in the user's infrastructure.

You can access the relevant findings via dashboards, and you can go to the relevant analysis table by clicking on the data.

<figure><img src="/files/H9KQeZOysvlA979rghYS" alt=""><figcaption></figcaption></figure>

When you right-click on any data, you can provide list management under "List Management" from the options that appear on the screen. Similarly, if a special rule needs to be defined, you can create a special rule with the "Rule Management" -> "Add value as a Classification Rule" option and trigger the notification mechanism. The rule management explained in this link <https://docs.cloudcyte.com/getting-started/classification-rules>.


# Active Directory Integration

The CyberCyte portal provide Active Directory integration for more comprehensive visibility. We recommend it for machines without an agent on the domain, accounts with unchanged passwords, locked accounts and analysis of the domain infrastructure.

## 1. Create Remote Credential in Portal

Please navigate to "Settings & Reporting" -> "Integration Settings" -> "Credential Settings". Click on the "+ Credential" button to create a new credential. Select the "WINDOWS" as a "Credential Type".

<figure><img src="/files/otuMg8Zh3PKEoLbU6Ucx" alt=""><figcaption></figcaption></figure>

## 2. Create a Repository on the Portal

Please navigate to "Settings & Reporting" -> "Integration Settings" -> "Repository Management". Click on the "+Repository" button to create a new AD(Active Directory) repository and select the "Active Directory" as Type, and please select the credential that we created in the first step as a "Remote Credential". After that fill the rest of the blank fields, the "Pull from Server" option should be disabled. Please save the settings after everything is defined.

<figure><img src="/files/AajobZ2OK11Hpy5pxYJ4" alt=""><figcaption></figcaption></figure>

## 3. Create a Policy in the Portal

Please navigate to "Rules & Policies" -> "Policy Management" -> Click on the "+ Policy" button. Please select the module named "Scenario and Network Discovery" and type named "Active Directory Analysis". After the selection, required fields will appeared. Please fill in the blanks with required values. For default values, users can use these values in images below.

<figure><img src="/files/djlPYMBmcVGuNilXAfiT" alt=""><figcaption></figcaption></figure>

<figure><img src="/files/YPJ2opUKbWmvifPMYkXz" alt=""><figcaption></figcaption></figure>

The users can assign this policy to their group(s). Also, the collection intervals can be changed to their requirements.

The users can add custom tags by just typing and hitting the enter. The policy will automatically accept the tags.

## 4. Reviewing the Results

Please navigate to "Dashboards" -> "Asset & Identity" -> "Domain Overview". The "Domain Overview" and "Asset Overview" dashboards provides a great visibility on the active directory and domain information.

<figure><img src="/files/pHYGNGeeItQZmiGU1Lqv" alt=""><figcaption></figcaption></figure>

Also, the results can be analyzed from under the "Threat Hunting" -> "Analysis & Investigation" -> "Identities".

<figure><img src="/files/15oQHZYPRYyH5KwdORx2" alt=""><figcaption></figcaption></figure>

After integration, the data obtained must be validated and, if necessary, white-listing or rule definitions must be made. There are already defined rules on CyberCyte, and listing can be done with additional analyses to these rules. Our primary recommendation is to double-check in parallel with the existing solutions in the user's infrastructure.

You can access the relevant findings via dashboards, and you can go to the relevant analysis table by clicking on the data.

<figure><img src="/files/H9KQeZOysvlA979rghYS" alt=""><figcaption></figcaption></figure>

When you right-click on any data, you can provide list management under "List Management" from the options that appear on the screen. Similarly, if a special rule needs to be defined, you can create a special rule with the "Rule Management" -> "Add value as a Classification Rule" option and trigger the notification mechanism. The rule management explained in this link <https://docs.cloudcyte.com/getting-started/classification-rules>.


# CrowdStrike Integration

The CyberCyte portal provide CrowdStrike integration for more comprehensive visibility. We recommend it for observe all the CrowdStrike security events from users infrastructure from one portal.

## 1. Create API Key

Please login to the CrowdStrike Falcon Management Console and navigate to "Support and resources" -> "Resource and tools" -> "API Client and keys". In that page, please create a API client and save "Client ID", "Secret" and "Base URL".

<figure><img src="/files/oIZfUEGQ9ygswe3lK4WK" alt="" width="317"><figcaption></figcaption></figure>

These scopes should be selected:

| Scope           | Read | Write |
| --------------- | ---- | ----- |
| Alerts          | True | True  |
| Hosts           | True | False |
| Host Groups     | True | False |
| Incidents       | True | True  |
| Sensor Download | True | False |
| Vulnerabilities | True | False |
| Detections      | True | False |

<figure><img src="/files/fNrjZ2UxJsDw2crHU4q9" alt="" width="319"><figcaption></figcaption></figure>

## 2. Falcon Sensor Configurations

Please login to the CrowdStrike Falcon Management Console and navigate to "Host setup and management" -> "Deploy" -> "Sensor downloads". Please save the "Customer ID".

<figure><img src="/files/XdZWX1gxkO5ZD4ywHLvk" alt="" width="240"><figcaption></figcaption></figure>

## 3. Create Remote Credential in Portal

Please navigate to "Settings & Reporting" -> "Integration Settings" -> "Credential Settings". Click on the "+ Credential" button to create a new credential. Select the "CorwdStrike Credential" as a "Credential Type". The Client ID, Client Secret and Cloud Destination variables already created in the previous steps.

## 4. Create a Repository on the Portal

Please navigate to "Settings & Reporting" -> "Integration Settings" -> "Repository Management". Click on the "+Repository" button to create a new CrowdStrike repository and select the "CrowdStrike" as Type and fill the rest of the blank fields like below. The "Credentail" section is explained in the previous step. Please enable the repository and edit the sync interval, by default 15 minutes recommended.

## 5. Create a Policy in the Portal

Please navigate to "Rules & Policies" -> "Policy Management" -> Click on the "+ Policy" button. Please select the module named "CrowdStrike Health Analysis" and type named "CrowdStrike Health Analysis". After the selection, required fields will appeared. Please fill in the blanks with required values, demonstration is provided below:

If the organizaiton uses CrowdStrike on cloud they can select "Install From Cloud", if they are not they can select "Install From Local Package". This option is allows agent to install CrowdStirke if it is not installed. For these actions, agents requies a CrowdStrike credentails that we provided previously. The "Custom Installation Command" seciton is designed for that feature, the CID parameter is required for installations.

Also, CID (CrowdStrike ID/Customer ID) information should be provided inside of the policy.

The "Perform Repair" option is designed for unhealthy CrowdStrike agents, with that CrowdStrike agent is repaired by CyberCyte agent. This action is optional.

The "Collect Diagnostic Data" option allows CyberCyte agent to get the CrowdStrike agent health state and event data.

The "Maintenance Intervals" are default 09:00 to 18:00, but it can be change depends on the organization requirements.

## 6. Reviewing the Results

The CrowdStrike health state can be observed from under the "Analysis & Investigation" -> "Artifact Analysis" -> "Threat Management" -> "CrowdStrike Anlaysis".

Also, please navigate to "Analysis & Investigation" -> "Artifact Analysis" -> "Threat Management" -> "CrowdStrike Events" to analyze the CrowdStrike events on the CyberCyte portal.


# Palo Alto - Cortex Integration

The CyberCyte portal provide Palo Alto - Cortex integration for more comprehensive visibility. We recommend it for observe all the Palo Alto - Cortex security events from users infrastructure from one portal.

## 1. Create Remote Credential in Portal

Please navigate to "Settings & Reporting" -> "Integration Settings" -> "Credential Settings". Click on the "+ Credential" button to create a new credential. Select the "Palo Alto Cortex API Credential" as a "Credential Type". The Client ID, Client Secret and Base URL should be provided by user, they are unique variables. These uniqe variables can be get it from Palo Alto platform.

## 2. Create a Repository on the Portal

Please navigate to "Settings & Reporting" -> "Integration Settings" -> "Integration Management". Click on the "+Integration" button to create a new CrowdStrike repository and select the "Palo Alto Cortex XDR" as Type and fill the rest of the blank fields like below. The "Credentail" section is explained in the previous step. Please enable the integration and edit the sync interval, by default we recommend 15 minutes.

## 3. Create a Policy in the Portal

Please navigate to "Rules & Policies" -> "Policy Management" -> Click on the "+ Policy" button. Please select the module named "Asset" and type named "Palo Alto Cortex XDR Health Analysis Policy". After the selection, required fields will appeared. Please fill in the blanks with required values, demonstration is provided below:

If XDR agent is not running on users devices, CyberCyte can detect that and install it or attempt to repair the agent. The users can define custom installation command for these actions.

Also, users can enable EDR, DLP and host firewall on the Palo Alto HypverVisor. The HyperVisor integration will be explained in the next page.

## 4. Reviewing the Results

The results can be observed from under the "Analysis & Investigation" -> "Artifact Analysis" -> "Threat Management" -> "Palo Alto Cortex XDR Alerts".

Also, please navigate to "Analysis & Investigation" -> "Artifact Analysis" -> "Threat Management" -> "Palo Alto Cortex XDR Analysis" to observe the Palo Alto Cortex XDR health state on the CyberCyte portal.


# Palo Alto HyperVisor Integration

The CyberCyte portal provide Palo Alto - Cortex integration for more comprehensive visibility. We recommend it for observe all the Palo Alto - Cortex security events from users infrastructure from one portal.

## 1. Create Remote Credential in Portal

Please navigate to "Settings & Reporting" -> "Credential Settings". Click on the "+ Credential" button to create a new credential. Select the "Palo Alto Cortex API Credential" as a "Credential Type". The password should be provided by user. These uniqe variable can be get it from Palo Alto platform.

## 3. Editing The Policy in the Portal

Please navigate to "Rules & Policies" -> "Policy Management" -> Edit the "Palo Alto XDR Health Analysis" policy that we created in the previous page. Please select the "Supervisor Credential" and optionally enable the futures like "Uninstall If Not Running", "Perform Repair", "EDR/DLP Enabled", "Host Firewall Enabled". Demonstration is provided below:

If XDR agent is not running on users devices, CyberCyte can detect that and install it or attempt to repair the agent. The users can define custom installation command for these actions. Also, users can enable EDR, DLP and host firewall on the Palo Alto HypverVisor.

## 4. Reviewing the Results

The results can be observed from under the "Analysis & Investigation" -> "Artifact Analysis" -> "Threat Management" -> "Palo Alto Cortex XDR Alerts / Incidents".

Also, please navigate to "Analysis & Investigation" -> "Artifact Analysis" -> "Threat Management" -> "Palo Alto Cortex XDR Analysis" to observe the Palo Alto Cortex XDR health state on the CyberCyte portal.


# OpenVAS Integration

The CyberCyte portal can integrate with OpenVAS for further analysis and investigations.  To integrate, please follow these steps:

## 1. Create Remote Credential in Portal

Please navigate to "Settings & Reporting" -> "Integration Settings" -> "Credential Settings". Click on the "+ Credential" button to create a new credential. Select the "API Credential" as a "Credential Type".

## 2. Create a Repository on the Portal

Please navigate to "Settings & Reporting" -> "Integration Settings" -> "Repository Management". Click on the "+Repository" button to create a new OpenVAS repository and select the "OpenVAS" as Type and fill the rest of the blank fields like below.

## 3. Reviewing the Results

The results can be observed from under the "Security Assurance" -> "Vulnerability Management" -> "Vulnerability Scan Results".


# Tenable Nessus

The CyberCyte portal can integrate with Tenable Nessus for further analysis and investigations.  To integrate, please follow these steps:

## 1. Create Remote Credential in Portal

Please navigate to "Settings & Reporting" -> "Integration Settings" -> "Credential Settings". Click on the "+ Credential" button to create a new credential. Select the "API Credential" as a "Credential Type".

## 2. Create a Repository on the Portal

Please navigate to "Settings & Reporting" -> "Integration Settings" -> "Repository Management". Click on the "+Repository" button to create a new Tenable Nessus repository and select the "Tenable Nessus" as Type and fill the rest of the blank fields like below.

## 3. Reviewing the Results

The results can be observed from under the "Security Assurance" -> "Vulnerability Management" -> "Vulnerability Scan Results".


# Gophish Integration

The CyberCyte portal can integrate with Gophish for further analysis and investigations.  To integrate, please follow these steps:

## 1. Create Remote Credential in Portal

Please navigate to "Settings & Reporting" -> "Integration Settings" -> "Credential Settings". Click on the "+ Credential" button to create a new credential. Select the "Gophish API Credential" as a "Credential Type".

## 2. Create a Repository on the Portal

Please navigate to "Settings & Reporting" -> "Integration Settings" -> "Repository Management". Click on the "+Repository" button to create a new Gophish repository and select the "Gophish" as Repository Type and fill the rest of the blank fields like below.

## 3. Gophish Usage and Reviewing The Results

The Gophish can e used results can be observed from under the "Security Assurance" -> "Human Risk Management".


# Prowler Integration

The CyberCyte portal can integrate with Gophish for further analysis and investigations.  To integrate, please follow these steps:

## 1. Triggering the Background Job

Navigate to "MSSP“ -> "SUPERORG Management", it will automaticly trigger the background job.

## 2. Setting Up The Linux Server and Scanner Component

1. Login to the Linux server for deployment of the cloud scanner component. Please use SFTP for uploading the component to the server (CyberCyte will prove the scanner component). Execute these comments below on the Linux server:

* `chmod +x /tmp/CyberCyteCloudExposureScanner-<version>`
* `mv CyberCyteCloudExposureScanner-<version> CyberCyteCloudExposureScanner`
* `/tmp/CyberCyteCloudExposureScanner --setup`

This commands for inital deployment. For the upgrade please execute these commands:

* `chmod +x /tmp/CyberCyteCloudExposureScanner-<version>`
* `mv CyberCyteCloudExposureScanner-<version> CyberCyteCloudExposureScanner`
* `/tmp/CyberCyteCloudExposureScanner --update`

2. After initial setup please configure settings.json with these values below:

`{`\
`"concurrent_orgs": 5, -> How many org that can be handled at the same time,`\
`"endpoint_url": "`[`https://xxx.yyy.com`](https://preprod.cloudcyte.com/)`" -> The portal address`\
`}`

3. Start the service after the configuration with these command below:

* ./CyberCyteCloudExposureScanner --install-service

After the starting the service it should be appear under the “/#/console/cloud\_exposure\_scanner\_settings”.

## 3. Connection Configurations

To create a credential for AWS or Azure Cloud services used in the infrastructure, we need to follow the steps below:

### **Amazon Web Services (AWS):**

Please login to the AWS portal and navigate to “AIM” → “My Security Credentails” (<https://us-east-1.console.aws.amazon.com/iam/home?region=eu-north-1#/security_credentials>). Under the “Access Keys” we need to create an access key and secret key, then take these values to the CyberCyte portal.

<figure><img src="/files/XOPjS9rgfHEh16qG2dzL" alt=""><figcaption></figcaption></figure>

### **Microsoft Azure:**

1. &#x20;Login to the Azure portal and navigate to “App Registrations” and create an app with “Single Tenant” with no URL.
2. &#x20;On the created app, configure API permissions with permiting these values below:

**Directory.Read.All**

**Policy.Read.All**

**UserAuthenticationMethod.Read.All (optional, for MFA checks)**

<figure><img src="/files/LMkZvjLQd2TF9zi0e8PP" alt=""><figcaption></figcaption></figure>

3. &#x20;Save and grant the permissions.
4. &#x20;Navigate “Certificates & Secrets” and click on the “Add Client Secret” inside of the app. This action will create an new secret. The “Value” is client secret and under the “Overview” section there is “Tenant ID” and “Subscription ID”. Save these values, we will use that values in the next steps.

<figure><img src="/files/RzZLb8BfXi37l0YOVosN" alt=""><figcaption></figcaption></figure>

5. Take some of the role form Prowler’s official repository and save it as a json file:

&#x20;[<img src="https://github.com/fluidicon.png" alt="" data-size="line">prowler/permissions/prowler-azure-custom-role.json at master · prowler-cloud/prowler](https://github.com/prowler-cloud/prowler/blob/master/permissions/prowler-azure-custom-role.json)

6. &#x20;Configure json files values like this:

`"assignableScopes": [`\
`"/subscriptions/<SUBSCRIPTION ID>"`\
`],`

7. &#x20;After configuration, please navigate to Azure portal again, under the “Subscription” → “IAM” click on “+Add” button and save .json file as a custom role. After adding the custom role, click on the “+ Add Role Assignment” and assign this role as a applicaiton member.

<figure><img src="/files/OdsREjqoZthNud5IBLA1" alt=""><figcaption></figcaption></figure>

<figure><img src="/files/NSg3ifCxK5p2hhjA0HoI" alt=""><figcaption></figcaption></figure>

8. &#x20;Back to the CyberCyte portal and create a credential with selecting “Graph API”.

## 4. Creating a Policy For Integration

For creating a policy select "Scenario/Discovery/Integration" -> "Cloud Configuration”. Select the credential, the group assignment is not important.

<figure><img src="/files/mxa9SyE8UgVHpKgO33QZ" alt=""><figcaption></figcaption></figure>

## 5. Checking The Results

We can observe the results under the “Security Assurance”: “/#/security\_assurance/cloud\_configuration\_management/security\_controls\_prowler\_results”

<figure><img src="/files/uLw17CbJG7r7a2Y4UPkS" alt=""><figcaption></figcaption></figure>


# Agentless Monitoring

The CyberCyte can collect and allow users to monitor the data without even installing the agent. For the agentless approach, please follow these steps below.

## 1. Deploying The Linux Agent

Please navigate to "Settings & Reporting" -> "Deployment Settings" and copy the "Linux Service Installer" command and execute it on one of the Linux device in the infrastructure. This is a mandatory and single deployment for agentless approach.

## 2. Assigning The Credentials

Please navigate to "Settings & Reporting" -> "Credential Settings" and click on the "+ Credential" button.

<figure><img src="/files/TeqeVtJ49d1s3Ts4gIty" alt=""><figcaption></figcaption></figure>

CyberCyte support Windows, SSH and also all kind of SNMP connections. But with SNMP connections, agent can only discover device and can't execute any analysis command in the machine; only the device name, OS kind and general details about machine, nothing specific about it.

<figure><img src="/files/t5PjqeoKeGE6KklCOw1J" alt=""><figcaption></figcaption></figure>

## 3. Policy Configuration

Please navigate to "Rules & Policies" -> "Policy Management" and edit/create "IP Scan & Penetration Testing" policy. This is a built-in policy and disabled by default.

<figure><img src="/files/Q6nAPFkzV4PwvoDUyBZV" alt=""><figcaption></figcaption></figure>

The some of the important values below needs to configured properly:

* Collection Interval: The general data collection interval.
* Scanner Host: This host will be the same as the agent installed Linux device.
* IP Blocks: This section contains important, the users will define IP block in their infrastructure.
* Port Scan Settings: This is selected by default and staticly configured, no extra configuration required.

<figure><img src="/files/8C9phMcbX5UROOABWidO" alt=""><figcaption></figcaption></figure>

* Credentials for Host Information Gathering: In this section users can select the defined credentials for enumaration. The portal will try to login to devices with each credential defined in the policy.&#x20;
* Agentless Collection Commands: This section provides collection commands that will run in the device after connection. This section can be configured based on the organization infrastructure.
* Agentless Windows Connection Priority: This section is pre-defined, no additional configuration required.

<figure><img src="/files/tnbowcNLdxaRCRBpZlcQ" alt=""><figcaption></figcaption></figure>

After the configuration please save the policy.

## 4. Monitoring The Devices & Results

Please navigate to "Endpoints & Network Devices" -> "Endpoint Devices" -> "Asset Management" or "Network Discovered Devices". The devices will be appeared on the portal as soon as conneciton established. The general device information can be observed in these pages.

<figure><img src="/files/NNYcHIlbd1SJSYKeMdax" alt=""><figcaption></figcaption></figure>

For the analysis results, please navigate to "Analysis & Investigation" -> "Artifact Analysis" -> "Agentless Discovery Artifacts". The collected data can be observed in that page with detailed information. The classifications can be customized based on the organization requirements.

<figure><img src="/files/PgxGz4ffTtjn9ncWS7YZ" alt=""><figcaption></figcaption></figure>

<figure><img src="/files/FY65wvSFMKSrHAes8ZGj" alt=""><figcaption></figcaption></figure>


# How to Use CyberCyte Platform Effectively?

While using the portal, effectiveness becomes important. Please follow these steps to use the portal effectively and optimally.

## 1 ) Enable Login Activity Monitoring (Optional)

Please navigate to "Settings & Reporting" -> "Policy Management" -> Click on the "+ Policy". Select the module and type. The users can assign the policy to the groups and change the data collection interval.

## 2 ) Enable Endpoint Securtiy Software Analysis (Optional/Recommended)

Please navigate to "Settings & Reporting" -> "Policy Management" -> Click on the "+ Policy". Select the module and type. The users can assign the policy to the groups, change the data collection interval, select the security software. This policy checks the health state of the security software.

After enabling the endpoint security software analysis, please navigate to "Threat Hunting" -> "Analysis & Investigation" -> "Threat Analytics" -> "Endpoint Security Software Analysis" and compare the results with security software center. Often security centers falsely flag the health of their software, which is where CyberCyte comes in to validate it.

## 3 ) Enable Browser History Analysis (Optional)

This policy is built-in, so users don't have to create it. The users can change the initial history and collection interval. After reviewing the policy, users can assign the policy to the group(s).

## 4 ) Disable EDR/DLP Tests

The EDR/DLP analysis module is in progress, for now, we don't recommend activating it. If users request the policy, please be aware that it is experimental for now.

## 5 ) Eliminate False Positives

The users can eliminate the false positives with white-listing. On the portal, every artifact can be added to the list, like the demonstration below:

## 6 ) Activate Sysmon AI Rule Automation

AI Analysis Auto Exclusion Settings

The portal provides wide configuration options on AI auto-enrichment and auto-exclusions. The "AI Analysis Auto Exclusion Settings" should be saved before it starts to work. For that, users set the settings parameters.

<figure><img src="/files/iGYHH6nV2kNByFK78yfx" alt=""><figcaption></figcaption></figure>

| Parameter                                                                              | Description                                                                                                |
| -------------------------------------------------------------------------------------- | ---------------------------------------------------------------------------------------------------------- |
| Classify, Enrich & Auto-whitelist for Windows processes                                | Enabling/Disabling the auto-classify, auto-enrichment, and auto-whitelisting for Windows processes.        |
| Classify, Enrich & Auto-exclude on Sysmon for Windows processes                        | Enabling/Disabling the auto-classify, auto-enrichment, and auto-whitelisting for Sysmon Windows processes. |
| Minimum Count Threshold for Auto AI Analysis Exclusions                                | The treshold setting for auto-analyze the artifacts.                                                       |
| Minimum Elastic Count Threshold for Auto AI Analysis Exclusions (optional, 0=disabled) | The elastic treshold for auto-exclusion.                                                                   |
| Auto AI Analysis Exclusions Run Interval                                               | The auto-exclusion run interval.                                                                           |
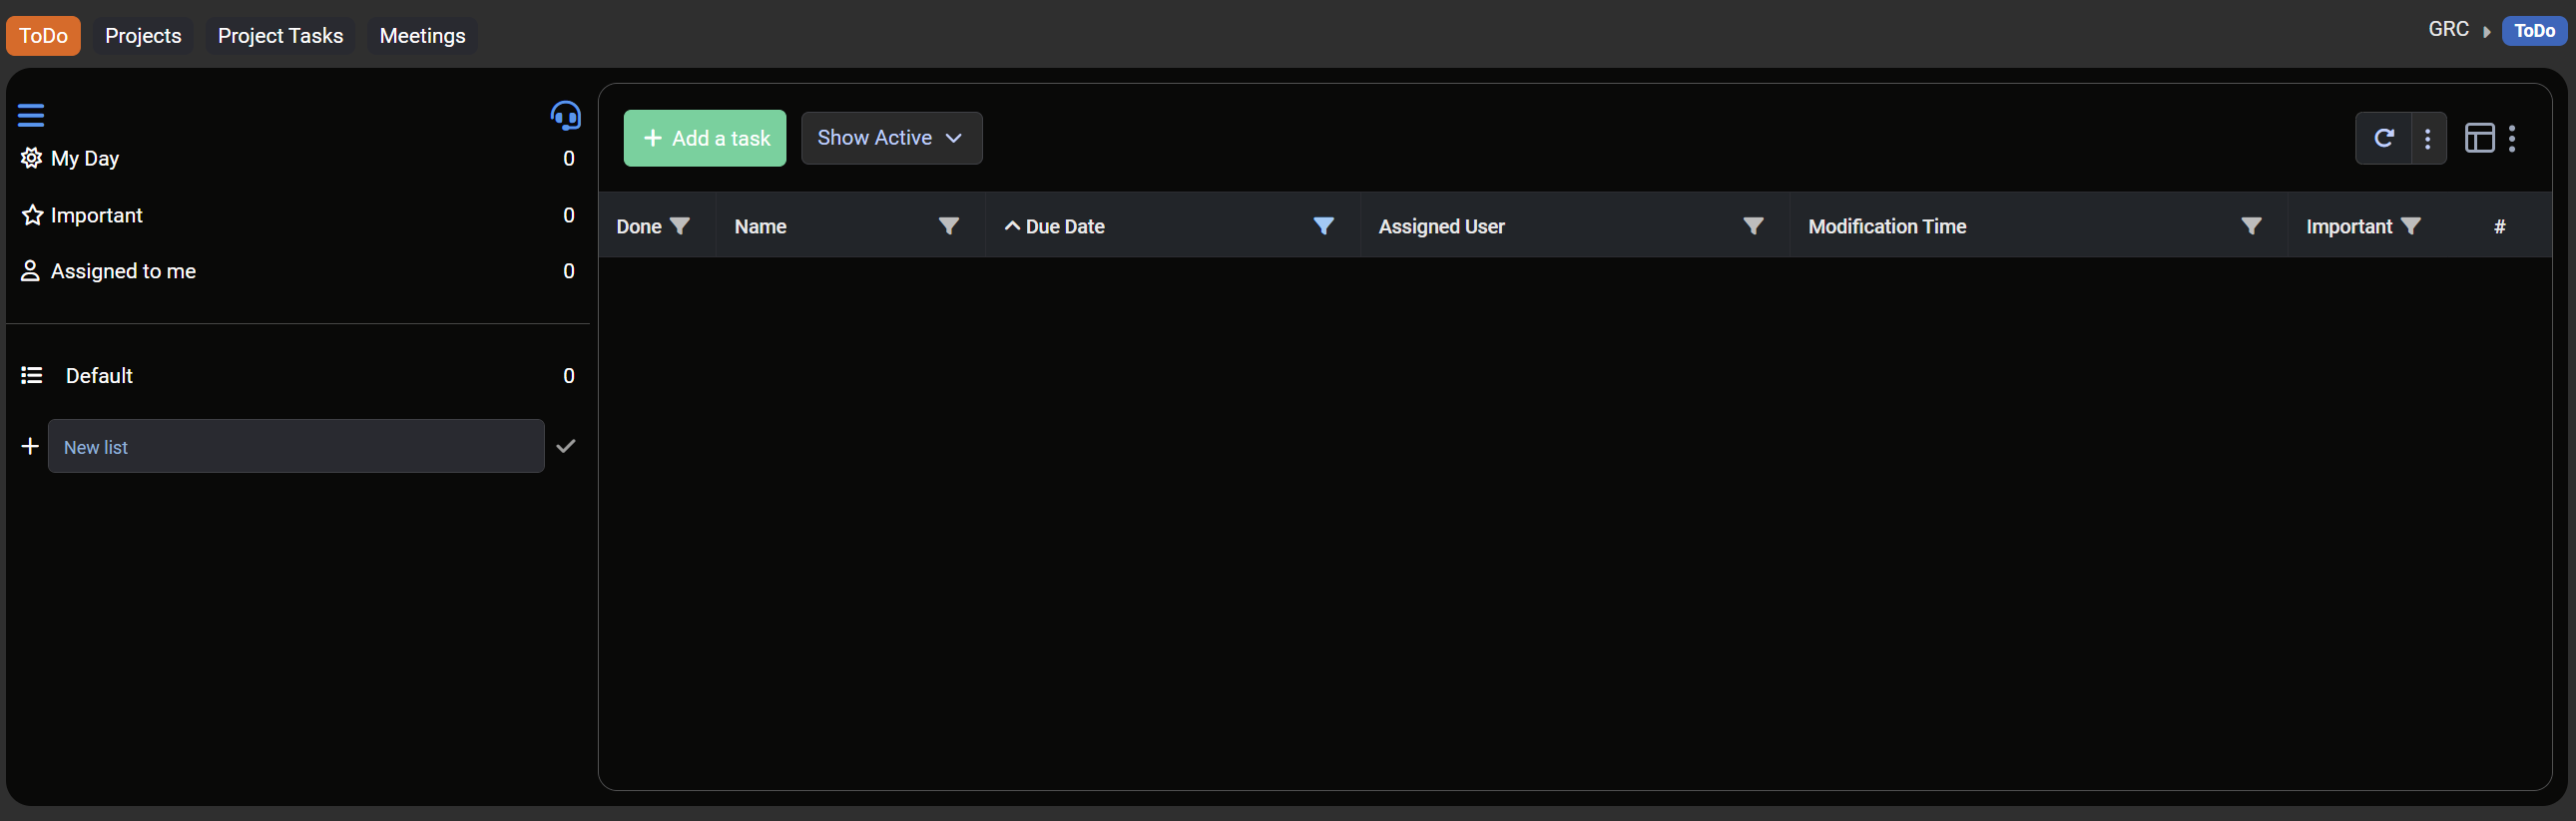
| Auto AI Analysis Exclusions Last Execution                                             | The auto-exclusion last execution time and date.                                                           |

***

On every global interval matching along each enabled question's interval, any entry recommended to be excluded over the minimum threshold will be added to relevant exclusions by the Task automatically. The question checks Threat Intelligence Enrichments and AI Classifications to decide recommendations and excludes any value matching on 'Excluded Values from Auto Exclusions'.

The "AI Questions for Auto Exclusions" section is designed for auto-exclusion actions. Users can edit and disable/enable the automation options. We recommend allowing the "Can you identify the Windows parent processes creating excessive traffic in the last day and show them to me to add to the Lists?" question. This recommended option allows the portal to exclude parent processes that create excessive traffic on the last day. This is specifically designed for automating sysmon exclusions.

Questions having the same text combine different artifact types in a single analysis, so if you edit any configuration or interval for each of these, you'll need to edit in the same way for the others, and also make the question reflect the configuration accordingly (such as time range). Failure to edit all common with common values for configurations will break how they execute, which one will get prioritized is not pre-determined!

When you edit a Question, then you'll lose the ability to get the updates coming in newer versions for that question if they were to exist. You might then use the 'Remove & Reset' functionality to remove the question & it'll appear back with the updated state in a while. This, of course, means you'll lose your changes of it.

If exclusions are not optimized well, the portal will eventually get slower because of the junk data collection. That's why we always suggest optimizing sysmon exclusions.

<figure><img src="https://docs.cloudcyte.com/~gitbook/image?url=https%3A%2F%2F1723175359-files.gitbook.io%2F%7E%2Ffiles%2Fv0%2Fb%2Fgitbook-x-prod.appspot.com%2Fo%2Fspaces%252F-LuHp6M9xm4Gdg2pWusc%252Fuploads%252F8pvTvtxGF6NDe0Xu3vNN%252Fimage.png%3Falt%3Dmedia%26token%3D80d9ecb7-d061-4810-ad24-5974e3a27122&#x26;width=768&#x26;dpr=4&#x26;quality=100&#x26;sign=e73e45db&#x26;sv=1" alt=""><figcaption></figcaption></figure>

**Excluded Values from Auto Exclusions**

The users can define values for auto exclusions. Values will be excluded from auto-exclusion by AI question executions. Also, values will be compared case-insensitively. Use \* as a wildcard and ? for single character matching.

<figure><img src="https://docs.cloudcyte.com/~gitbook/image?url=https%3A%2F%2F1723175359-files.gitbook.io%2F%7E%2Ffiles%2Fv0%2Fb%2Fgitbook-x-prod.appspot.com%2Fo%2Fspaces%252F-LuHp6M9xm4Gdg2pWusc%252Fuploads%252F9vrseE90OjXI3N9Q2LGS%252Fimage.png%3Falt%3Dmedia%26token%3D7039e0b3-6b4e-4110-bf7c-477159b7d3dd&#x26;width=768&#x26;dpr=4&#x26;quality=100&#x26;sign=de9be2b5&#x26;sv=1" alt=""><figcaption></figcaption></figure>

## 7 ) Optimize Sysmon

Through the sysmon analysis screen accessed from "Threat Hunting" -> "Analysis & Investigation" -> "Windows Sysmon Analysis", sysmon rules can be modified. The right-click action on the value to be added enables the direct addition of a log property to the rule. Right-click -> "Sysmon Rules Mgmt." -> "Add to Image & Network Access Exclusions" action is used to add the value to a sysmon rules.

<figure><img src="/files/DUUWIO2hiCh3VrxnZmtW" alt="" width="283"><figcaption></figcaption></figure>

## 8 ) Enable Reporting & Malicious Notifications

Go to "Moust Used" -> "Initial Settings & Deployment". The configurations will be applied after save.

<figure><img src="/files/V9CP6Xzq6FWzHYF5jzhY" alt=""><figcaption></figcaption></figure>

## 9 ) Enable ISO27001 Assessment

Please navigate to "GRC" -> "Assessment Management" -> "Assessments" and create an ISO 27001 assessment, attach an owner or a owner group and save.

<figure><img src="/files/txqDzvDbYwGTKYDUrinZ" alt=""><figcaption></figcaption></figure>

## 10 ) Enable AI From SUPERORG Settings

To enable auto-classification, please go to "MSSP" organization -> "Organization Management" -> "Organization Management". Click three dots right side of the grid and click on the "Edit" button. On the modal, scroll to the bottom and select the "Enable AI" option. This action will enable the auto-classification of artifacts.

<figure><img src="https://docs.cloudcyte.com/~gitbook/image?url=https%3A%2F%2F1723175359-files.gitbook.io%2F%7E%2Ffiles%2Fv0%2Fb%2Fgitbook-x-prod.appspot.com%2Fo%2Fspaces%252F-LuHp6M9xm4Gdg2pWusc%252Fuploads%252FN4W53niGfxQ5Hiyu6xsW%252Fimage.png%3Falt%3Dmedia%26token%3Dd1b6dff0-a343-47e4-9f83-942e8771b007&#x26;width=768&#x26;dpr=4&#x26;quality=100&#x26;sign=e8ada49a&#x26;sv=1" alt=""><figcaption></figcaption></figure>

<figure><img src="https://docs.cloudcyte.com/~gitbook/image?url=https%3A%2F%2F1723175359-files.gitbook.io%2F%7E%2Ffiles%2Fv0%2Fb%2Fgitbook-x-prod.appspot.com%2Fo%2Fspaces%252F-LuHp6M9xm4Gdg2pWusc%252Fuploads%252FTTFaZlQOwMGfIHgYZtLf%252Fimage.png%3Falt%3Dmedia%26token%3D377b02b3-2709-4632-91e6-8fd51a4472e8&#x26;width=768&#x26;dpr=4&#x26;quality=100&#x26;sign=91b8eb28&#x26;sv=1" alt="" width="375"><figcaption></figcaption></figure>


# Enabling External Exposure Analysis

**External Exposure** refers to an organization’s internet-facing systems, services, or assets that are vulnerable to potential threats. Open ports, weak APIs, DNS misconfigurations, and outdated applications expand the attack surface, making them attractive targets for external threats. Continuous monitoring, regular vulnerability assessments, and proper configurations are essential to mitigate these risks effectively. CyberCyte provides a continuous analysis solution for external exposure.

***

The module has two separeted component. First one is "Scanner Component" and second one is "CyberCyte Intel". The "Scanner Component" should be installed on the customer's environment if they are using CyberCyte portal with on-premise deployment. The "CyberCyte Intel" is designed for cloud-based deployments.

## With Scanner Component

This section is designed for after steps of the scanner component deployment. The CyberCyte IT team will deploy the scanner on the customer side and after that these steps should be applied one by one:

* First of all, please contact with the CyberCyte IT support. The module will configure with customer requirements.
* Login to the CyberCyte portal.
* Navigate to "Rules & Policies" -> "Policy Management" -> Search for "External Asset Discovery Default Policy" with search bar. Click on the policy or click on the three dots on the right side of the policy and click on "Edit".
* In the policy:
  * The default scan interval is 24 hours, but it can be changed.
  * Users need to provide the domain address to the policy.
  * "Execute Vulnerability Scan" option should be enabled.
* Click on the "Save" button and make sure to provide domain addresses to CyberCyte IT support.

<figure><img src="/files/XLyWlWHjdJJbEcgBnczN" alt=""><figcaption></figcaption></figure>

Next steps for CyberCyte portal admins, normal users cannot be acces to the "MSSP" organization.

* After configuration of the policy, please change organization to "MSSP".Please navigate to "Asset Mgmt. & Threat Intel" -> "External Exposure Scanner Settings".
* Click on the three dots at the right side of the grid and click on "Edit" button.
* On the "Assigned Organizations" section, please select the organization(s).
* Please make sure "Tenable Nessus Address", "Tenable Nessus Access Key" and "Tenable Nessus Secret Key" is provided.
* Click on the "Save" button and wait for the results. The data should be appear in a day.
* Please switch back to users organization and navigate to "Most Used" -> "External Exposure Overview". The data's will be displayed on this page, click on the entries that displayed on the grid. This action take user to specific analysis grid.

## CyberCyte Intel

This section is designed for cloud-based deployments, but cloud-based deployment can also use the "Scanner Component" because it is already integrated with CyberCyte's cloud portal. Please let the CyberCyte IT team for external exposure analysis, CyberCyte IT team will take care of the assignments. The data will be collected in a day and users can be observe the results under the "Most Used" -> "Welcome" -> "Artifact Summary" section.

Next steps for CyberCyte portal admins, normal users cannot be access to the CyberCyte Intel.

* Please login to CyberCyte Intel and navigate to "SUPERORG Management" -> "External Exposure" -> "Queries".
* Click on the "+ Query" button to create a query. The "Query" section should be a domain name provided by customer. Also, please enable the "Enabled" option and click on the "Save" button.
* The results can be observe from customer's organization and also on the CyberCyte Intel. On the "SUPERORG Management" -> "External Exposure" page, click on "All Data", "Cybersquatting" or one of the available sections. These sections will show all of the query results under one grid.


---

[Next Page](/llms-full.txt/1)